
An evaluation study of research efficiency of the Guangzhou institute of respiratory diseases based on malmquist index
Introduction
Data envelopment analysis (DEA) is a kind of multi-objective decision-making method, which uses optimization techniques to evaluate the efficiency of homogeneous evaluation objects with multi input and multi output. In this paper, the Malmquist model of DEA is used to analyze the running efficiency of the Guangzhou Institute of Respiratory Diseases (GIRD). Furthermore, we aimed to explore factors associated with the development to bring forward suggestions.
Methods
Data sources and research objects
The data for this paper were obtained from the scientific research management department of Guangzhou Medical University and the GIRD. In this study, data were collected with personnel, financial and material inputs, scientific awards score and other outputs in 2009–2013 from 19 project research teams of the GIRD. The trend of the total factor productivity (TFP), technical efficiency, technical changes and other aspects of 19 project research teams from 2009 to 2013 were evaluated.
Data envelopment analysis
The evaluation objects of DEA are also called decision making units (DMUs). The method was proposed by American operations research scientists (A.Charnes, W.W.Cooper and E.Rhodes) in 1978. It can calculate the relative efficiency of DMUs and also point out the index of excess or insufficient output for the low efficiency unit (1). More importantly, the DEA method is non-parametric in nature, which does not require pre-estimated parameters and uniform units. It can provide an index that incorporates various measurements with good stability and sensitivity. Therefore, it has many advantages such as avoiding subjective factors, simplifying algorithm and reducing errors, etc. (2,3).
Malmquist index
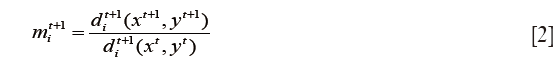
For panel data, the change of efficiency of DMUs in a certain period of time cannot be analyzed by using traditional model, the Malmquist index (MI) model is needed. It was established to measure the TFP of each DMUs in different period by using panel data (4).This paper mainly applied the DEA based MI method proposed by Färe et al. (5), to evaluate the dynamic changes of the TFP of the 19 project teams in the GIRD from 2009 to 2013. Moreover, this method is widely used in finance, medical treatment, enterprise and other related aspects. In this study, we take each project team as a DMU and Malmquist TFP index can be calculated on the panel data for each DMU in different periods. In addition, the dynamic change trend of the efficiency of DMUs is obtained and MPI is used to objectively measure the relationship between technical efficiency change, technical change and total factor change (6). According to the definition of Caves, Christense et al. (4), the change in the productivity of the period from t to t+1 under the technical level of t period can be expressed as:

Among them, (xt, yt) respectively, on behalf of the input and output vector of the DMUs, dit (xt,yt) represents the distance between the DMUs in the t period and the efficiency frontier in the period of t. The variable dit(xt+1,yt+1) indicates the distance between the DMUs in the t+1 period and the efficiency frontier in the period of t. Similarly, under the technical conditions of the period of t+l, the change of productivity from the period of t to t+l can be expressed as:
In order to avoid the differences in the randomness of time selection, Caves, Christensen and Diewert (1982) et al. suggested that the geometric mean of mit and mit+1 were used to calculate the MI. Its formula is expressed as:
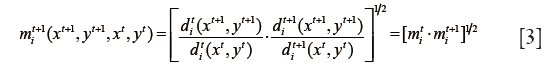
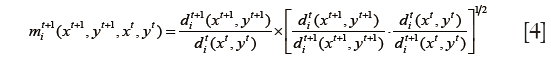
Among these variables: x,y respectively, the input and output indicators, t represents the year. Formula (3) indicates the total factor productivity change of the production function point (xt+1,yt+1) as compared to the production function point (xt,yt), if mit+1(xt +1,yt +1,xt,yt)<1,it indicates that the TFP of the period of t +1 is decreased in comparison with the period t; if mit+1(xt +1,yt +1,xt,yt)= 1, it indicates that compared to the t period, the t+1 period of the TFP does not change; if mit+1(xt +1,yt +1,xt,yt)>1,it means that compared to the t period, the t+1 period of TFP is increased. In addition, dit (xt, yt) indicates the current technical efficiency level of technical efficiency in the period of t, dit+1 (xt+1,yt+1) indicates the current technical efficiency level of technical efficiency in the period of t+1, dit (xt +1,yt +1) indicates the efficiency value of the DEA of the t+1 period, relative to the t phase of the technology; and dit +1 (xt, yt) indicates the efficiency value of the DEA of the t period, relative to the t+1 phase of the technology (7). Meanwhile, Färe et al. further decompose the Formula (3) into Formula (4). As shown below:
In addition, MPI is a commonly used index to compare total productivity changes over time. Caves et al. (4) firstly used MPI for productivity measurement. Total productivity change could be decomposed into three main components. We can calculate MPI through the following equation: MPI =Technical efficiency change (Effch) × technological changes (Techch). Furthermore, Technical efficiency change could be decomposed to include two separate components: Pure efficiency change (Pech) and scale efficiency change (Sech); therefore we can write = (Pech × Sech) × Techch (8,9). This decomposition could help a research institute to realize the reason of productivity change in a particular time period. According to the input-oriented DEA approach, the MPI >1 indicates performance improvement of a research institute via minimization of inputs, and the index upper than 1 shows the worsening performance of a research institute (8). Specifically, the production technology of DMUs can be improved when the value of technical efficiency change is >1, and vice versa; the management improvement makes the efficiency increase when the pure technical efficiency change value >1, it indicates that the change of factor input leads to the increase of scale efficiency when the scale efficiency change value >1, technological change value >1, it means that technological progress, and vice versa for technical setbacks (10).
Input and output
In order to select more scientific and reasonable input and output indicators in this study, the following considerations were based on in the process of selecting indicators: (I) reflection of the evaluation content in an objective manner; (II) technically, the strong linear relationship between the internal indicators of input and output sets should be avoided; (III) the availability of the data. At the same time, the method should follow the principle of “systematic, feasible, objective and scientific” (11). Besides, the selection of indicators for the efficiency of scientific research innovation was based on the experts’ opinions and previous studies (2,12-14). There are seven variables in the input-oriented Malmquist index model, including three input variables and four output variables. The detailed definitions are illustrated in Table 1. Information on indicator values are also shown in Table 2. The input measures included number of scientific research personnel, scores of scientific research projects and scientific research funds. On the other hand, the output measures included SCI points, research awards score, invention patent score and graduate students score.

Full table

Full table
Analysis
Using DEAP 2.1, a computer program that is designed to conduct DEA, we analyzed total factor productivity change and its components including technological change, technical efficiency change, and scale efficiency change for each project research team during 2009–2013.
Results
The results of this research were shown in Table 3. The results indicated that the productivity changes of the included project research teams in this study ranged between 0.801 and 2.171. The most and least optimal project research teams were DMU11 and DMU7, respectively. The results also showed that the total factor productivity index of GIRD in 2009–2013 was 1.304, indicating that in the year 2013, the total productivity of GIRD increased by 30.4 percentage points when compared to 2009. Only 4 (DMU7, DMU10, DMU12 and DMU18) out of the 19 DMUs in the analysis were found to be relatively inefficient during the study period. The total factor productivity of these four DMUs were less than 1, which indicated that they were not at the forefront of efficiency. In addition, the overall productivity of DMU7, DMU10, DMU12 and DMU18 decreased by 19.9%, 18.8%, 6.1% and 0.9%, respectively, when compared with that in 2009. The main reason for the decline in the overall efficiency was the reduction of technical efficiency. Among them, the decline of TFP for DMU12 and DMU10 was mainly caused by the decrease of pure technical efficiency and the decrease of scale efficiency. However, the TFP decline of DMU18 and DMU7 was mainly due to the decrease of pure technical efficiency. The TFP of the remaining 15 DMUs were greater than 1, which indicated that the TFP of the 78.94% (15/19) DMUs in GIRD was in a growing trend. Among them, the largest increase was DMU11 (117.1%), followed by DMU13 (103.7%). In summary, the vast majority of 19 DMUs’ TFP growth was mainly dependent on technological progress. Furthermore, the scale effect change of 4 project research teams was equal to 1, and they were: DMU5, DMU7, DMU8 and DMU9. Pure efficiency change of 4 project research teams was equal to 1, and they were: DMU1, DMU4, DMU5 and DMU9 (Table 3).

Full table
According to our analysis (Table 4), the total productivity during all the study years was 1.304 on average. This showed that overall, there was an improvement in productivity in the years of study. This was accompanied by the improvement of technological progress. In this study, the annual average growth rate of technological changes, technical efficiency change, pure efficiency change, and scale efficiency change had reached 22.5%, 6.4%, 0.9% and 5.4%, respectively. Therefore, the greatest contribution of the improvement of the TFP for GIRD was technological changes. There was a fluctuation in the trend of productivity over the study period (Figure 1), and the TFP of GIRD showed an upward trend from 2009 to 2013. However, the TFP growths were not stable but volatile, i.e., the annual growth rate was 2.6%, 56.9%, 13.1% and 58.6%, respectively. Further analysis showed that the efficiency of scientific and technological progress (whose value is 0.786) grow negatively during 2009–2010, the growth of TFP was mainly dependent on the expansion of the scale effect (the value is 1.153) and the improvement of the pure technical efficiency (the value is 1.133). The technical change efficiency for these two years (2011–2012, 2012–2013) was less than 1 and the values were 0.998 and 0.873, respectively. The fact that each index was greater than 1 during 2010–2011 illustrated that during this period, the input and output of GIRD was driven by catch-up effect and growth effect, the overall efficiency of scientific research have increased significantly. Finally, the growth of TFP was largely caused by the increase of technical efficiency change (increased by 12.7 percentage points) and the efficiency of technological progress (the growth rate was 39.3%).

Full table

Discussion
It is believed that the Malmquist index method is appropriate for evaluating the dynamic change of the efficiency of DMUs. This method can analyze factors that influence the development of productive forces, which relies on technological progressing or management level improving. During the period 2009–2013, we found that technological progressing has played a key role in the increase of total factor productivity. The total factor productivity, the technological change and the technical efficiency change were 1.304, 1.225 and 1.064, respectively. Technological progress index describes the change of cutting-edge technology, namely “frontier mobile” effect which represents the progress of technology and innovation. In this study, 17 out of 19 investigated project research teams had averagely improved in term of technological change in the years of study. The largest and smallest increases in the technical progress index were DMU14 (74%) and DMU5 (1.4%), respectively. The technical efficiency change was described in organization and its management from the period of t to period t+1, namely the “catch-up effect”. Moreover, the mean value of the technical efficiency change was greater than 1, and this suggested a catch-up effect of scientific research efficiency and the research ability of GIRD in these years have been improved. Besides, the technical efficiency change of the 68.42% (13/19) DMUs in GIRD was greater than 1 and their growth rate fluctuated between 0.5–64.5%. Therefore, in order to further improve the input-output efficiency of scientific research activities, we should continue to strengthen the technological innovation and progress while maintaining the improvement of technical efficiency.
As one of the main body of science and technology production activities, scientific research institutions play an increasingly more important role in the development of science and technology. Meanwhile, its scientific and technological activities have the characteristics of multi-objective, complex and systematic. Consequently, the research purpose, method and content also showed diversity (15).
What is more important is that technical efficiency reflects the change of efficiency of the organization’s technology policy and system. The higher technical efficiency is associated with better efficiency of technology production. The change of production technology reflects the trend of improvement, stagnation or degradation of the key hard conditions (e.g., personnel quality and equipment level), which determine the scientific and innovative production. From the point of measurement, the change of technical efficiency reflects the short-term innovation potential of the organization; on the contrary, technological progress reflects its long-term ability to innovate. As Nishimizu and Page (1982) (8) thought. (I) The “catching up effect” of the technical efficiency leads to the increase of the actual output; (II) the growth effect caused by technological progress is not only the improvement of the short-term output level, but also the sustainable growth of the economy. Their essential difference is that the catch-up effect will disappear over time, but the growth effect will still maintain or increase instead. In this study, we found that 21.1% (4/19) research teams’ TFP index during the period of 2009–2013 was less than 1, the most severe decline was found in DMU7, followed by DMU10 with the decline rate being 19.9% and18.8%, respectively. The decline of TFP in DMU10 was mainly caused by the decrease of pure technical efficiency and the decrease of scale efficiency. However, the decline of TFP of DMU7 was only due to the decrease of pure technical efficiency. Therefore, for some teams with more serious decline in TFP, they not only need to introduce advanced management mode, but also focus on the optimal allocation of resource. At the same time, strengthen the introduction of talent and continue to maintain the absorption of new technology and innovation. Moreover, overall average scale efficiency index was 1.054 and the growth rate (5.4%) was at a low level. Nevertheless, the growth rates of a few teams were satisfactory as reflected by the scale efficiency (such as: DMU6 increase of 32.8%). Therefore, we should maintain a moderate scale development, it is necessary to avoid an increase in management cost and idle equipment caused by the excessive scale, and wary of the scale is too small to play the maximum effectiveness of the teams. Moreover, we also need to continue to optimize the team structure, thereby improving overall operational efficiency.
The study found that the annual average growth rate of technological progress was relatively high, compared to the speed of technical efficiency. Although technical efficiency has contributed to the improvement of the TFP of the project research teams, the effect of technical progress efficiency was obvious and need to be further strengthened. Thus we should increase the investment in the field of scientific research and deepen the introduction of science and technology innovation and strengthen the digestion of new technologies.
According to the results of the dynamic analysis of the GIRD during 2009–2013, we found that the overall TFP of the institute was on the rise, but the TFP growth was unstable but volatile, the range were 2.6–58.6%. As a result, we should pay more attention to the internal management of scientific research system when introducing talents and promoting technological progress. Besides, it is necessary to make a systematic development plan of scientific research. Given continuous adjustment and improvement of the plan, the combined efforts in technical efficiency and progress efficiency could foster the development of scientific research efficiency. As a result, it enhances the overall strength of scientific research and promotes the steady development of the GIRD. Meanwhile, we must be alerted to the blind pursuit of technological progress, while ignoring adapt to the new research environment, otherwise it will lay hidden danger for future research activities. Therefore, we should pay more attention to the absorption of scientific research and practical application, and make a reasonable development plan of scientific research, when focusing on scientific research innovation and reform. On the one hand, we should allocate scientific research resources in a more rational manner with the use of various means to improve management and technological level. On the other hand, we should improve research management environment and keep the growth of research efficiency remains stable, sustained and balanced.
This study had some limitations. First, only longitudinal research grants were included to ensure the quality and availability of data, and research tenders were not included as research outputs. Hence, there might be a challenge in generalizing the results to the entire GIRD. Second, our results were largely dependent on the selection of inputs and outputs for measuring productivity in this study. It would be useful to adopt other analytical methods to include other inputs and outputs for project research teams studied in this paper to examine the consistency of the study results. Last but not least, the marks of inputs and outputs may also exert an influence on the study result.
Conclusions
In conclusion, the growth of TFP for GIRD resulted mainly from technical progress and efficiency improvement, and technological progress played a leading role. In addition, a handful of project research teams whose TFP declines seriously would require closer attention to technological innovation and scale improvement, along with optimization of scientific research development planning.
Acknowledgements
None.
Footnote
Conflicts of Interest: The authors have no conflicts of interest to declare.
References
- Shi A, Xu Q. An Empirical Analysis of Allocation Efficiency of Science & Technology Resources in China Based on Super——Efficiency DEA and Malmquist Index Model. Science and Technology Management Research 2015;35:54-9.
- Xin DQ. Evaluation of input-output efficiency of state key laboratory based on DEA. Experimental Technology and Management 2014;31:220-3.
- Li Y, Wang DL, Wang B, et al. Establishment Analysis of Hospital Provincial Key Laboratory Personnel Construction Based on Data Envelopment Analysis. Chinese Hospital Management 2015;35:54-6.
- Caves DW, Christensen LR, Diewert WE. The Economic Theory of Index Numbers and the Measurement of Input, Output, and Productivity. Econometrica 1982;50:1393-414. [Crossref]
- Färe R, Grosskopf S, Norris M, et al. Productivity Growth, Technical Progress, and Efficiency Change in Industrialized Countries. The American Economic Review 1994;84:66-83.
- Liu BL, Lin T, Liu YH. Study on Dynamic Efficiency of Steel and Iron Enterprises in China from Scale and Ownership Perspectives——Based on Malmquist TFP Index. China Soft Science 2010:150-7.
- Wang CX, Ngok KL, Zhou F, et al. Dynamic change on the productivity of township health centers after China's health care system reform: Based on the nonparametric Malmquist index in Guangzhou,Guangdong Province,2009—2013. Chinese Journal of Health Policy 2014;7:49-54.
- Varmaghani M, Meshkini AH, Farzadfar F, et al. Evaluation of productivity in Iranian pharmaceutical companies: A DEA-based Malmquist approach and panel data analysis. J Res Pharm Pract 2015;4:51-6. [Crossref] [PubMed]
- Chen X, Zuo Y, Dan Z, et al. Research on the Total Productivity Change of Township Hospitals in Weifang from 2009 to 2012. Chinese Health Economics 2014;33:70-2.
- Lu GY, Zhao D, Lin YR. Evaluation of Operational Effciency for National-level High-tech Industrial Development Zones: Based on the DEA-Malmquist Index and Clustering Method. Journal of Zhejiang Sci-Tech University 2014;32:449-55. (Social Sciences).
- Qi Yang. LI J. The Innovation Performance Evaluation Index System for Scientific Research Institutions in Guizhou Province Based on the Fuzzy Comprehensive Evaluation Method. SCI-TECH INFORMATION DEVELOPMENT & ECONOMY 2011;21:129-33.
- Xu J. An Evaluation of Relative Input-output Efficiency of Research in Higher Education Institutions in China:A Data Envelopment Analysis(DEA). Tsinghua J 2009;30:76-80.
- Wang ZB, Xu ZW, Li YK, et al. Evaluation of university seniority of scientific research and evaluation index design about sci-technology innovation ability. Journal of Hefei University of Technolog 2005;19:1-8. (Social Sciences).
- Li MM, Li Y. Efficiency Evaluation of Beijing Co-construction Key Laboratories based on Data Envelopment Analysis. Science and Technology Management Research 2014;(4):48-52.
- Meng W, Li Q, Liu WB. Creating indicators system based on 3E theory. Studies in Science of Science 2007:908-14.

