
Radiomic analysis in T2W and SPAIR T2W MRI: predict treatment response to chemoradiotherapy in esophageal squamous cell carcinoma
Introduction
Esophageal carcinoma (EC) is the 8th most commonly occurring types of malignancy, including more than 450,000 new cancer diagnoses yearly, and also the 6th leading cause of cancer-related mortality with an estimated approximately 400,000 deaths every year (1). Esophagostomy is an effective therapeutically method in the treatment of patients with early-stage disease. Unfortunately, most patients diagnosed with esophageal cancer present at locally advanced stage with unresectable or metastatic disease, for which concurrent chemoradiotherapy (CRT) is currently considered as the best palliative option, as it can improve survival and reduce the local recurrence rate in patients who respond to the treatment (2). On the other hand, patients who are insensitive to CRT (18–25%) may be harmed unnecessarily by the toxicity of an ineffective therapy without prognostic benefit (3). Therefore, early identification of patients who are at higher risk of poor response before CRT would allow personalization of their treatment.
Recent advancements in magnetic resonance imaging (MRI) protocols and techniques have resulted in better imaging quality with the potential to be applied in staging, radiation treatment planning, and the assessment of therapeutic response (4). Previous studies have shown the value of MRI in predicting treatment response for glioma (5), rectal cancer (6), and nasopharyngeal carcinoma (7). For EC, diffusion-weighted imaging (DWI) and dynamic contrast-enhanced MRI (DCE-MRI) can provide complementary information for the prediction of treatment response early to CRT, besides measurements of dimensional changes in tumor diameter or volume on anatomical MRI (8,9). For example, Aoyagi et al. showed that the apparent diffusion coefficient (ADC) value could be used as a biomarker to predict treatment response for patients with esophageal squamous cell carcinoma (ESCC) (8) and more recently, Heethuis et al. found that changes in tumor area-under-the-concentration time curve (tAUC) value derived from DEC-MRI are promising for prediction of histopathologic response to neoadjuvant CRT (nCRT) for EC (9). However, although the effect of these clinical indicators was demonstrated over the past years, little attention has been paid to the predictive capability of pretreatment anatomical MRI (T2W and SPAIR T2W). Therefore, new tools based on the aforementioned sequences are expected for the prediction of treatment response early before CRT.
Radiomics is a novel image analysis technology that has received much attention in recent years due to its innovative properties, which provide valuable information regarding to tumor phenotype (10-14). This innovative method focuses on the improvement of image analysis by converting medical images into high-dimensional quantitative features via post-processing techniques. It then involves comprehensive analyses of these features with clinical outcomes using reproducible and robust methodology. Recent studies have shown that radiomic biomarkers based on positron emission tomography (PET) and computed tomography (CT) are associated with staging, treatment response, and survival across a range of cancer type (15-20). However, compared to PET and CT, MRI provides excellent contrast between the tumor and its surrounding structures, which allows tumor margins to be contoured more accurately (4). To our knowledge, no published study has determined whether the treatment response to CRT in ESCCs could be early predicted by a radiomics method using anatomical MRI (T2W and SPAIR T2W).
Thus, the purpose of this study was to use radiomic features derived from T2W- and SPAIR T2W-MRI combined with supervised machine-learning algorithms to predict treatment response to CRT in ESCC patients.
Methods
Patient database
The retrospective database contained pretreatment MRI images from 68 patients who histologically diagnosed with ESCC at our institution from February 2015 to December 2016. This study was approved by the Nanjing Drum Tower Hospital’s ethics committee (No. 2015-063-09) and informed consent from the patients was provided. Two different MRI series were acquired from the same image location, including T2W- and SPAIR T2W-MRI. All the patients were considered to be inoperable and not received chemotherapy or radiotherapy before MRI scan. The other inclusion criteria were met: normal cardiac, pulmonary, and hematologic function. Endoscopic ultrasonography (EUS), chest/abdominal CT scan with contrast-enhanced and chest MRI scan were used for the staging of the patients according to the AJCC 7th. Baseline patient characteristics were summarized in Tables 1,2.

Full table

Full table
CRT
All patients were irradiated with 2 Gy per fraction in 30 fractions for intensity modulated radiation therapy (IMRT). The dose prescriptions were designed to cover at least 96% of planning target volume (PTV). During the whole course of radiotherapy, patients underwent 2–3 cycles of synchronous chemotherapy (nedaplatin + docetaxel/paclitaxel).
Treatment evaluation
One month after the completion of the treatment, therapeutic response was assessed by using CT/MRI image with contrast, according to the Response Evaluation Criteria in Solid Tumors (RECIST) (21). Patients with complete response (CR) or partial response (PR) were considered responders, while patients with stable disease (SD) or progressive disease (PD) were classified as nonresponders
MR image acquisition and tumor segmentation
All patients underwent a pretreatment 3.0 T MR scan from the same scanner (Philips Achieva 3.0T X-series, Philips Healthcare, Best, The Netherlands) according to a standard clinical acquisition protocol as follows: T2W MRI [repetition time (TR)/echo time (TE): 554.4/80 millisecond (msec); flip angel, 90 degrees; matrix size, 512×512; slice thickness, 5 mm; in-plane resolution, 0.70 mm × 0.70 mm] and SPAIR T2W MRI (TR/TE: 569.2/70 msec; flip angel, 90 degrees; matrix size, 432×432; slice thickness 4 mm, in-plane resolution 0.87 mm × 0.87 mm). The regions of interest (ROIs) were semi-automatically delineated by two expert radiologists (S Li for ROI-1 and W Ren for ROI-2) for each sequence using commercially available software (MIM Software, Cleveland, Ohio, USA) and then reviewed by an experienced radiologist (J Yan). The contours for each ROI were drawn around the largest cross-sectional area of the tumor lesion avoiding fat, air, and bone (Figure 1).

Image preprocessing
Although patients underwent MR examination using the same scanner, changes of parameter settings and voltage may result in different MR imaging intensity ranges (22,23). In order to correct for these variations, the contoured ROIs were normalized using a two-step process as requires: (I) image filtering and (II) gray-level quantization. The first step (image filtering) was performed using a Winner filter to reduce the image noise. The second step normalized the voxel values within the ROIs to a finite gray-level range as follows:
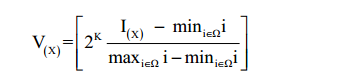
where 2k represent the four different discrete values [16, 32, 64, 128], I is the intensity of the raw image, and Ω is the pixels set in the delineated volume. These steps reduced the noise in the image and normalized the intensity range across patients, which in turn facilitate the comparison of the radiomic features. Previous studies showed that no statistically significant difference was found in choosing different resampling values (22,24,25), and 64 discrete values were chosen in our study.
Radiomic feature extraction
Imaging Biomarker Explorer Software V1.0β (IBEX) (26) and MATLAB 2015a (Mathworks, Natick, MA, USA) were used to extract radiomic features from delineated two-dimensional (2D) ROIs. IBEX is an open software platform that aimed to support radiomics workflow tasks such as multimodality image data import/export, review, preprocessing, and feature extraction. Using IBEX software, several categories features were extracted, including intensity histogram (IH), gradient-orientation histogram (GH), gray-level co-occurrence matrix (GLCM; directions: 0°, 45°, 90°, 135° and mean; offset: 1 pixel distance), gray-level run-length matrix (GLRLM; directions: 0°, 90° and mean), and neighborhood intensity difference matrix (NIDM; neighborhood size: 3×3). In addition, our study contained more features than IBEX by adding Gabor wavelet transform (GWTF, five wavelet scales and eight filter orientations) (23), which performed using MATLAB software. All patients’ DICOMs files (MR images + ROI structures) were first exported from MIM software and then imported into the above modules to compute radiomic features.
In all, 138 radiomic features were extracted from each image sequence based on three principal methods: histogram-based (IH, GH), texture-based (GLCM, GLRLM, and NIDM), and transform-based (GWTF). More detailed contents of the extracted features are summarized in Table S1.

Full table
Inter-observer variability evaluation and feature reduction
Inter-observer variability of radiomic features extraction was assessed using intra-class correlation coefficient (ICC). It was performed to quantify the feature reproducibility in repeat delineation (ICC <0.40, poor agreement; 0.40≤ ICC <0.60, moderate agreement; 0.60≤ ICC <0.80, good agreement; ICC ≥0.80, excellent agreement). ICC analysis was performed using “irr” package (version 0.84) in R software (version 3.3.2) (27). In our study, radiomic features with ICC greater than 0.8 were extracted.
Additionally, pair-wise correlations of the studied features were also considered. For these highly reproducible features (ICC ≥0.80), a correlation matrix was created and absolute correlation coefficients (ACC) were computed using “caret” package (version 6.0-77) in R software. The ACC values close to 1 mean the features are correlated parameters. In our study, radiomic features with ACC greater than 0.8 were removed.
Statistical analysis
All statistical analyses were performed using R software version 3.3.2. The capability of each influential feature (ICC ≥0.8 and ACC <0.8) to classify patients with different treatment response were evaluated using the Kruskal-Wallis test (P<0.05), and Dunn-Bonferroni test was used for post hoc comparisons (24). Receiver operating characteristic (ROC) curves and area under the curve (AUC) analysis were used to assess the diagnostic efficacy of each studied features for discrimination among various treatment responses [95% confidence intervals (CIs), specificity and sensitivity were also calculated]. AUC with a value of 1 means an ideal result, while values lower than 0.5 indicates insignificant.
Feature selection and model construction
Radiomic features extracted from the two sequences (T2W and SPAIR T2W) were separately modeled using support vector machine (SVM) and artificial neural network (ANN) algorithms. All patients were randomized into two groups: 43 for training (23 responders, 20 nonresponders) and 25 for validating (14 responders, 11 nonresponders).
To reduce the training time and avoid model over-fitting, the feature dimension should be reduced firstly. Based on the training group, we chose wrapper-based feature selection method (28) to generate optimal feature subset for the specific model (SVM or ANN). This method separately performed on each feature group (features extracted from T2W and SPAIR T2W with ICC ≥0.8 and ACC <0.8) by recursively removing features and then assessing the predictive power of the remaining features without missing any critical ones. After processing by the above method, feature dimension was further reduced.
To assess classification performance, 10-fold cross-validation (CV) approach was served as the internal validation in the training group. The specificity, precision and accuracy of the predictions were derived from true positives (TP), false positives (FP), true negatives (TN), and false negatives (FN). Additionally, Matthews correlation coefficient (MCC) were also obtained to measure the predictive ability of the classifier. The MCC parameter ranged from −1 to +1, and values of +1 represented ideal prediction, 0 implied the equivalent of a random guess, and −1 indicated an inverse prediction.
Statistical comparison between ANN and SVM models
The statistical difference between the performance of different models was assessed using McNemar’s test (29). The test was performed on the outcomes obtained from the 10-fold CV.
Validation
Patients (n=25, 14 responders and 11 nonresponders) who were not involved in model construction were then served as an independent validation set. The confusion matrix contained prediction result was used to calculate the specificity, precision, and accuracy.
Results
Treatment response after CRT
Patients were evaluated 1 month after the completion of CRT. Thirty-one patients were classified as responders (31 SD, 0 PD), while 37 patients were considered as nonresponders (17 CR, 20 PR).
Predictive capabilities
As discussed above, 138 radiomic features were extracted from each image sequence. ICC and ACC were computed for all radiomic features. Based on the above-mentioned criteria (ICC ≥0.8 and ACC <0.8), 47 features were generated for the T2W and 39 features for the SPAIR T2W. Details of the features are summarized in Table 3.

Full table
Result of Kruskal-Wallis test showed that 26 features (T2W: 11, SPAIR T2W: 15) could differentiate between CR and SD, 17 features (T2W: 11, SPAIR T2W: 6) could differentiate between PR and SD, and 33 features (T2W: 15, SPAIR T2W: 18) could differentiate between responders (CRs and PRs) and nonresponders (SDs). A summary of detailed results is shown in Tables 4,5. To differentiate responders from nonresponders, we analyzed the significant features with ROC curves and obtained the AUC values (T2W: 0.640–0.757, SPAIR T2W: 0.640–0.721). For example, GLCM_Contrast0° (T2W-based), with an AUC of 0.677 (sensitive =0.903, specificity =0.459), could differentiate between responders and nonresponders, with a cutoff of 11.595 (Table 6), indicating that tumor lesions whose GLCM_Contrast0° was higher than 11.595 were most likely from nonresponders. Similar results were obtained from the ROC analysis of SPAIR T2W-based features (Table 7).

Full table

Full table

Full table

Full table
Supervised classification and statistical comparison
Wrapper-based feature selection method was separately performed on T2W- and SPAIR T2W-based feature sets (features with ICC ≥0.8 and ACC<0.8, Table 3) to obtain the optimal feature subsets for each model (SVM and ANN), with the results showing that 4 T2W-based/7 SPAIR T2W-based features were selected for SVM and 4 T2W-based/4 SPAIR T2W-based features were selected for ANN. As for T2W sequence, two features (GLRLM_LRE0° and NIDM_Busyness) were both selected for these two models, and no histogram-based feature was selected. In the case of SPAIR T2W sequence, three features (GLCM_IV0°, GLCM_Correlation45° and Gabor_MSE-25) were both selected. Details of the optimal feature sets for each model are summarized in Table 8.

Full table
Table 9 summarizes the classification results obtained from training group by 10-fold CV, in terms of specificity, precision, weighted accuracy, and MCC for each model. Radiomic features derived from SPAIR T2W sequence (SVM: 0.929, ANN: 0.883) generally achieved higher predictive accuracy than those derived from T2W sequence (SVM: 0.893, ANN: 0.861).

Full table
Pairwise comparisons in McNemar’s test showed that no statistical differences were found between SVM and ANN models, implying that the choice of the models was not of substantial importance (P=0.999).
Validation result
Table 10 contains the detailed results of the model validation (testing group). Features extracted from SPAIR T2W sequence (SVM: 0.837, ANN: 0.843) achieved higher predictive accuracy than those derived from T2W sequence (SVM: 0.716, ANN: 0.675), which was consistent with internal validation (training group).

Full table
Discussion
Prediction of ESCC response to CRT before treatment initiation plays an important role in patient clinical management and allow for early modification of the treatment protocol in nonresponders. Within this context, prior works have documented the value of medical images in prediction of esophageal tumor response. For example, a meta-analysis suggested that a 50% reduction in SUVmean or SUVmax between pretreatment PET and a PET obtained within the first two weeks of nCRT was the optimal condition for the prediction of response to esophageal cancer (30). Recent studies also showed the DWI provides complementary information for tumor regression in response to CRT besides measuring the changes in tumor size on anatomical MRI and more pilot studies are currently ongoing (8,31,32). De Cobelli et al. (32) showed that the differences between pre- and post-treatment ADCmedian (or ΔADC) values were negatively correlated with pathological response (tumor regression grade, TRG).
More recently, there have been efforts reporting on the value of radiomic analysis for the prediction of treatment response in patient with esophageal cancer. Tixier et al. (24) showed that tumor radiomic features on baseline 18F-FDG PET was associated with clinical response to definitive CRT. In their study, several features (i.e., homogeneity, entropy, intensity variability, and size-zone variability) achieved superior discriminatory ability (AUCs, 0.82–0.89) over any SUV measurement (AUCs, 0.59–0.70). Tan et al. (33) found that changes of 18F-FDG PET-based radiomic features over treatment (Δfeatures) appeared more predictive of tumor response than pre- or post-treatment alone. While PET is expensive and time-consuming, CT is still the main imaging method in routine clinical practice. Yip et al. (34) determined the associations of contrast-enhanced CT radiomic features (pre- and post-treatment SD) with pathologic response. However, there has been no report to our knowledge to investigate the clinical potential of radiomic analysis using anatomical MRI (T2W and SPAIR T2W) for predicting the therapeutic response of ESCC. Previous studies have demonstrated that radiomic analysis of T2W MRI could predict the treatment response of patients with rectal cancer (35) and radiomic analysis based on T1W, T2W, and DWI could serve as imaging biomarkers of tumor response to CRT in nasopharyngeal carcinoma (23). To our knowledge, our study is the first to investigate the feasibility of radiomic analysis using T2W- and SPAIR T2W-MRI combined with supervised machine-learning algorithms for the prediction of treatment response to CRT in ESCC patients.
In present work, we found that both two radiomic feature subsets (15 features derived from T2W and 18 features derived from SPAIR T2W sequence) were able to discriminate between responders and nonresponders before CRT initiation with AUC values range from 0.640 to 0.757. The radiomic features were mathematical measurements calculated by depending on the arrangement of pixels, which could characterize the regularity of pixel distribution within the tumor space (36). The distribution of voxels in heterogeneous tumors showed more irregular than that in homogeneous tumors (37). In other words, tumor heterogeneity were correlated with tumor proliferation, cellularity, necrosis, and hypoxia (38) and may be related to poor response and worse prognosis. Tumor response therefore could be predicted, as it is closely associated with tumor heterogeneity. The above results showed that radiomic analysis of anatomical MRI (T2W- and SPAIR T2W) held great potential in differentiating different tumor response in patients with ESCC.
In addition, we analyzed the predictive performance of radiomic feature further by modeling using SVM and ANN algorithm. Zhang et al. (39) showed that radiomic features combined with SVM algorithm achieved higher accuracy in prediction of tumor response to CRT in patients with esophageal cancer. However, their study lacked a validation set (testing group) to evaluate real performance of the classifier. For each sequence, in present work, SVM and ANN were constructed on the training group (n=43) and then validated on the testing group (n=25). Additionally, in order to minimize the risk of modeling over-fitting and bias, we followed a range of robust processing methods: feature reproducibility assessment and dimensionality reduction, wrapper-based feature selection, and models constructed with 10-fold CV. After a series of above-mentioned processing, both two models based on different sequence (T2W and SPAIR T2W) achieved higher predictive accuracy (range, 0.861–0.929). These results might be attributed to the ability of radiomic analysis to indirectly capture the phenotypic information of tumors, including parameters not easily visible and quantifiable by simple visual analysis, which may be linked to tumor response. As for classifiers, SVM (T2W: 0.893; SPAIR T2W: 0.929) achieved better predictive performance than that of ANN (T2W: 0.861; SPAIR T2W: 0.883), although the difference was not statistically significant. Overall, our study indicates that radiomic models appear to be effective in prediction of tumor response and may facilitate better clinical decision making, particularly in the case of patients with ESCC.
However, some limitations are worth noting. Compared to 3D radiomic analysis methods, the only use of 2D slice has some limitations, as it is not sufficient to capture inter-slice features. Because of the larger slice thickness and gap, our study is inappropriate for 3D radiomic analysis method. In addition, due to relatively small sample size of patients and the retrospective nature of this study, our results should be validated in multiple centers with a larger and prospective patient cohort in the future.
In conclusion, combined with supervised machine learning algorithm, radiomic features extracted from T2W- and SPAIR T2W-MRI can be used as an adjunct tool for clinical practice in prediction of treatment response to CRT in patients with ESCC.
Acknowledgements
The authors would like to thank the reviewers for their insightful suggestions, which helped improve the manuscript.
Footnote
Conflicts of Interest: The authors have no conflicts of interest to declare.
Ethical Statement: This study was approved by the Nanjing Drum Tower Hospital’s ethics committee (No. 2015-063-09) and informed consent from the patients was provided.
References
- Ferlay J, Soerjomataram I, Dikshit R, et al. Cancer incidence and mortality worldwide: sources, methods and major patterns in GLOBOCAN 2012. Int J Cancer 2015;136:E359-86. [Crossref] [PubMed]
- Gebski V, Burmeister B, Smithers BM, et al. Survival benefits from neoadjuvant chemoradiotherapy or chemotherapy in oesophageal carcinoma: a meta-analysis. Lancet Oncol 2007;8:226-34. [Crossref] [PubMed]
- van Rossum PS, Xu C, Fried DV, et al. The emerging field of radiomics in esophageal cancer: current evidence and future potential. Transl Cancer Res 2016;5:410-23. [Crossref]
- van Rossum PS, van Lier AL, Lips IM, et al. Imaging of oesophageal cancer with FDG-PET/CT and MRI. Clin Radiol 2015;70:81-95. [Crossref] [PubMed]
- Dhermain FG, Hau P, Lanfermann H, et al. Advanced MRI and PET imaging for assessment of treatment response in patients with gliomas. Lancet Neurol 2010;9:906-20. [Crossref] [PubMed]
- Beets-Tan RG, Beets GL. MRI for assessing and predicting response to neoadjuvant treatment in rectal cancer. Nat Rev Gastroenterol Hepatol 2014;11:480-8. [Crossref] [PubMed]
- Zheng D, Chen Y, Liu X, et al. Early response to chemoradiotherapy for nasopharyngeal carcinoma treatment: Value of dynamic contrast-enhanced 3.0 T MRI. J Magn Reson Imaging 2015;41:1528-40. [Crossref] [PubMed]
- Aoyagi T, Shuto K, Okazumi S, et al. Apparent diffusion coefficient values measured by diffusion-weighted imaging predict chemoradiotherapeutic effect for advanced esophageal cancer. Dig Surg 2011;28:252-7. [Crossref] [PubMed]
- Heethuis SE, van Rossum PS, Lips IM, et al. Dynamic contrast-enhanced MRI for treatment response assessment in patients with oesophageal cancer receiving neoadjuvant chemoradiotherapy. Radiother Oncol 2016;120:128-35. [Crossref] [PubMed]
- Aerts HJ, Velazquez ER, Leijenaar RT, et al. Decoding tumour phenotype by noninvasive imaging using a quantitative radiomics approach. Nat Commun 2014;5:4006. [PubMed]
- Limkin EJ, Sun R, Dercle L, et al. Promises and challenges for the implementation of computational medical imaging (radiomics) in oncology. Ann Oncol 2017;28:1191-206. [Crossref] [PubMed]
- Lambin P, Rios-Velazquez E, Leijenaar R, et al. Radiomics: extracting more information from medical images using advanced feature analysis. Eur J Cancer 2012;48:441-6. [Crossref] [PubMed]
- Gillies RJ, Kinahan PE, Hricak H. Radiomics: Images Are More than Pictures, They Are Data. Radiology 2016;278:563-77. [Crossref] [PubMed]
- Kumar V, Gu Y, Basu S, et al. Radiomics: the process and the challenges. Magn Reson Imaging 2012;30:1234-48. [Crossref] [PubMed]
- Goh V, Ganeshan B, Nathan P, et al. Assessment of response to tyrosine kinase inhibitors in metastatic renal cell cancer: CT texture as a predictive biomarker. Radiology 2011;261:165-71. [Crossref] [PubMed]
- Goh V, Sanghera B, Wellsted DM, et al. Assessment of the spatial pattern of colorectal tumour perfusion estimated at perfusion CT using two-dimensional fractal analysis. Eur Radiol 2009;19:1358-65. [Crossref] [PubMed]
- Fried DV, Tucker SL, Zhou S, et al. Prognostic value and reproducibility of pretreatment CT texture features in stage III non-small cell lung cancer. Int J Radiat Oncol Biol Phys 2014;90:834-42. [Crossref] [PubMed]
- Fried DV, Mawlawi O, Zhang L, et al. Stage III Non-Small Cell Lung Cancer: Prognostic Value of FDG PET Quantitative Imaging Features Combined with Clinical Prognostic Factors. Radiology 2016;278:214-22. [Crossref] [PubMed]
- Mu W, Chen Z, Liang Y, et al. Staging of cervical cancer based on tumor heterogeneity characterized by texture features on (18)F-FDG PET images. Phys Med Biol 2015;60:5123-39. [Crossref] [PubMed]
- Knogler T, El-Rabadi K, Weber M, et al. Three-dimensional texture analysis of contrast enhanced CT images for treatment response assessment in Hodgkin lymphoma: comparison with F-18-FDG PET. Med Phys 2014;41:121904. [PubMed]
- Therasse P, Arbuck SG, Eisenhauer EA, et al. New Guidelines to Evaluate the Response to Treatment in Solid Tumors. J Natl Cancer Inst 2000;92:205-16. [Crossref] [PubMed]
- Li Z, Mao Y, Huang W, et al. Texture-based classification of different single liver lesion based on SPAIR T2W MRI images. BMC Med Imaging 2017;17:42. [Crossref] [PubMed]
- Liu J, Mao Y, Li Z, et al. Use of texture analysis based on contrast-enhanced MRI to predict treatment response to chemoradiotherapy in nasopharyngeal carcinoma. J Magn Reson Imaging 2016;44:445-55. [Crossref] [PubMed]
- Tixier F, Le Rest CC, Hatt M, et al. Intratumor heterogeneity characterized by textural features on baseline 18F-FDG PET images predicts response to concomitant radiochemotherapy in esophageal cancer. J Nucl Med 2011;52:369-78. [Crossref] [PubMed]
- Li Z, Mao Y, Li H, et al. Differentiating brain metastases from different pathological types of lung cancers using texture analysis of T1 postcontrast MR. Magn Reson Med 2016;76:1410-9. [Crossref] [PubMed]
- Zhang L, Fried DV, Fave XJ, et al. IBEX: an open infrastructure software platform to facilitate collaborative work in radiomics. Med Phys 2015;42:1341-53. [Crossref] [PubMed]
- Gamer M, Lemon J, Singh IFP. irr: Various Coefficients of Interrater Reliability and Agreement. R Package Version. 2012. Available online: https://cran.r-project.org/web/packages/irr/irr.pdf
- Kohavi R, John GH. Wrappers for feature subset selection. Artif Intell 1997;97:273-324. [Crossref]
- Salzberg SL. On Comparing Classifiers: Pitfalls to Avoid and a Recommended Approach. Data Min Knowl Discov 1997;1:317-28. [Crossref]
- Chen YM, Pan XF, Tong LJ, et al. Can 18F-fluorodeoxyglucose positron emission tomography predict responses to neoadjuvant therapy in oesophageal cancer patients? A meta-analysis. Nucl Med Commun 2011;32:1005-10. [Crossref] [PubMed]
- Imanishi S, Shuto K, Aoyagi T, et al. Diffusion-weighted magnetic resonance imaging for predicting and detecting the early response to chemoradiotherapy of advanced esophageal squamous cell carcinoma. Dig Surg 2013;30:240-8. [Crossref] [PubMed]
- De Cobelli F, Giganti F, Orsenigo E, et al. Apparent diffusion coefficient modifications in assessing gastro-oesophageal cancer response to neoadjuvant treatment: comparison with tumour regression grade at histology. Eur Radiol 2013;23:2165-74. [Crossref] [PubMed]
- Tan S, Kligerman S, Chen W, et al. Spatial-temporal [18 F] FDG-PET features for predicting pathologic response of esophageal cancer to neoadjuvant chemoradiation therapy. Int J Radiat Oncol Biol Phys 2013;85:1375-82. [Crossref] [PubMed]
- Yip C, Davnall F, Kozarski R, et al. Assessment of changes in tumor heterogeneity following neoadjuvant chemotherapy in primary esophageal cancer. Dis Esophagus 2015;28:172-9. [Crossref] [PubMed]
- De Cecco CN, Ganeshan B, Ciolina M, et al. Texture Analysis as Imaging Biomarker of Tumoral Response to Neoadjuvant Chemoradiotherapy in Rectal Cancer Patients Studied with 3-T Magnetic Resonance. Invest Radiol 2015;50:239-45. [Crossref] [PubMed]
- Castellano G, Bonilha L, Li LM, et al. Texture analysis of medical images. Clin Radiol 2004;59:1061-9. [Crossref] [PubMed]
- Ng F, Ganeshan B, Kozarski R, et al. Assessment of Primary Colorectal Cancer Heterogeneity by Using Whole-Tumor Texture Analysis: Contrast-enhanced CT Texture as a Biomarker of 5-year Survival. Radiology 2013;266:177-84. [Crossref] [PubMed]
- Ganeshan B, Goh V, Mandeville HC, et al. Non-small cell lung cancer: histopathologic correlates for texture parameters at CT. Radiology 2013;266:326-36. [Crossref] [PubMed]
- Zhang H, Tan S, Chen W, et al. Modeling pathologic response of esophageal cancer to chemoradiation therapy using spatial-temporal 18F-FDG PET features, clinical parameters, and demographics. Int J Radiat Oncol Biol Phys 2014;88:195-203. [Crossref] [PubMed]

