|
Original Article
Air pollution, weather variations and primary spontaneous pneumothorax
Luca Bertolaccini 1, Laura Alemanno 2, Gaetano Rocco 3, Claudio Cassardo 2
1Division of Thoracic Surgery, S. Croce e Carle Hospital, Cuneo, Italy; 2Department of General Physics "Amedeo Avogadro", University of Turin, Italy; 3Department of Thoracic Surgery and Oncology, National Cancer Institute - Pascale Foundation, Naples, Italy.
Corresponding to: Luca Bertolaccini, MD, PhD, Thoracic Surgery Unit (Chief: Alberto Terzi, MD), S. Croce City Hospital, 26 Michele Coppino St., Cuneo 12100, Italy. Tel : +39-0171-642286 ; Fax: +39-0171-642491. E-mail: luca.bertolaccini@unito.it
|
|
Abstract
Background: Spontaneous pneumothoraces (SP) tend to occur in clusters which have been related to atmospheric pressure variations and
thunderstorm insurgence. We examined the influence of standard meteorological parameter variations and concentrations of the major air
pollutants on incidence of spontaneous pneumothorax (SP) in a highly developed industrial area (Turin, Italy).
Methods: From October 2002 to December 2007, 591 SP patients were prospectively evaluated. For each day, standard weather parameters
and concentration of air pollutants were recorded.
Results: The total number of admissions for SP was 591. The number of days with admissions was 363, which represents the 19% of the total
number of days in the study period (1918). Eighty-one percent of days with SP admissions were clusterized. Results of statistical analysis
showed that the sequence of SP events was not random. There was relationship between SP and daily wind speed (WS) minimum, daily
standard deviation of NO2, NO2, CO2 daily maximum and minimum, O3 daily minimum, daily mean CO2 (p = 0.01), daily NO2 minimum (p
= 0.001). Multiple regression analysis has shown relationship between number of SP admissions and increase of daily mean and minimum
NO2 (p = 0.001), decrease of NO2 standard deviation (p = 0.01), decrease of daily mean and minimum O3 (p = 0.01), and of maximum of
NO (p = 0.001), increase of daily O3 standard deviation (p = 0.05). Daily decrement of standard deviation of temperature (p = 0.01) and increment
ofWS anomalies and minima (p = 0.01) were also significant.
Conclusion: Meteorological parameters and atmospheric pollutants might explain cluster hospitalization.
Key words
Meteorological parameters; atmospheric pollutants; spontaneous pneumothorax; clustering; spectral analysis; bivariate and multiple regression.
J Thorac Dis 2010;2:9-15. DOI: 10.3978/j.issn.2072-1439.2010.02.01.018
|
Although some studies hypothesize correlation of the development
of spontaneous pneumothorax (SP) with the atmospheric
pressure variations or thunderstorm insurgence, several other factors
seem to have an important role in its insurgence. It has also
been suggested that pneumothorax admissions occur in cluster ( 1, 2, 3, 4). Other investigators analyzed the influence of standard meteorological
parameter variations on SP insurgence but only few
studies, all at the limit of the statistical significance, showed positive
outcomes ( 3, 4, 5, 6, 7, 8). This work focused on the correlation
of SP with the meteorological variables and the concentrations
of the major air pollutants in Turin, one of the European cities with
the highest industrial density, where atmospheric particles (especially
the PM10), ozone and nitrogen dioxide levels consistently
exceed the legal threshold for urban areas. Due to the absence of previous studies linking SP to atmospheric chemical parameters,
the results were compared with those of similar studies carried out
in cases of asthma exacerbation ( 9, 10, 11, 12, 13).
|
|
Material and methods
Patients
The patients with documented SP included in this study came
from the north-western area of Turin and were admitted at the two
Hospitals of Azienda Sanitaria Locale Torino 2 between October
1 st, 2002 and December 31 st, 2007 (1918 days). When a patient call
the emergency service (e.g. 118), he is normally transported to the
hospital closer to his home; so in this study the patients came from
the north-western area of Turin. The samples contained all admissions
occurred in the period from October, 2002, to December,
2007. The list of patients with certified pneumothorax admitted in
the two hospitals represented two samples which were compared in
order to verify the homogeneity of the data, using a non-parametric
tests Kolmogorov-Smirnov, with a significance level p = 0.01. Being
the two populations comparable, SP events were assembled in
a single time series. The total number of admissions was 591, and
the number of days with admissions 363 (the 19% of the total). Traumatic or secondary pneumothoraces were excluded. SP relapses
were considered as new episodes of SP. SP episodes appeared
frequent, severe and temporarily disabling: SP is a medical emergency
and first aid intervention was rapid. Taking into consideration
the short time available for the break-down of cellular structures,
this study took into account only the variables recorded one
day before SP occurrence, instead of assessing the performance of
the variables in the preceding 3 to 4 days, as done by other investigators
( 2, 4, 6).
Meteorological and air quality data
For each day of the analyzed period, following meteorological
parameters and pollutant concentration data, measured in stations
located close to the hospitals were recorded: atmospheric pressure
P (hPa), temperature T (℃ ), relative humidity U (%), solar global
radiation R (W/m2), precipitation Pz (mm), average wind speed WS
(m s-1), gust wind speed WR (m s-1), NO, NO2, SO2, PM10, C6H6,
C7H8, O3 (µg m-3) and CO and CO2 (mg m-3). Average collecting
time for the variables was 10 minutes for Pz and WS, 30 minutes
for P, T, U and R, and 60 minutes for the others. Following parameters
were calculated: mean, maximum and minimum daily values,
daily standard deviations (σ), average daily anomalies (the daily
mean value of each day minus the average of the daily mean value
of that particular day in the other 5 years of the series), daily variations
defined as (difference between the daily maximum and minimum
values), +Δ(difference between the maximum value of the
day tth and the minimum value of the day (t-1)th) and Δ (difference
between the minimum value of the day tth and the maximum value
of the day (t-1)th).
Statistical analysis
Clinicians hypothesized that SP patients were admitted in
clusters ( 2, 4, 5, 6). In this study, a group of SP admissions was defined
a cluster in accordance with a specific algorithm based on
two "restrictive conditions" controlling the events aggregation or
breakdown. For first restriction, only events separated by not more
than 2 days between each other were considered as part of one
cluster. For second restriction, clusters spreading over more than 4
consecutive days were subdivided into 2 or more clusters, in order
to maintain the correlation of SP events with meteorological phenomena
or with pollution events. Then, statistical analyses on the
SP events time series, consisting on analyses of the distribution
characteristics, spectral autocorrelation and spectral analysis, were
carried out using MATLAB 1 with the aim to demonstrate the
non-randomness of the admissions with the time. The clusterization of admissions suggested that meteorological or pollution conditions
could play an important role in enhancing the SP development.
Thus, those conditions were considered as independent samples,
and analyzed using parametric (t-Student) and non-parametric
(Kolmogorov-Smirnov and Wilcoxon) tests. Since there were not
reasons to assume a causal relationship between the SP events,
analyses using bivariate and multivariate regression techniques
with software R 2 were performed. In this study, as the relationship
between the data is non-linear, a method of generalized regression
(GLM) was chosen, in which selected links were that of Poisson
and Logistic one. The series of the daily mean, maximum and minimum
values, daily σ, daily anomalies and Δ and ± Δ differences
were analyzed with bivariate regression for each meteo-chemical
parameter. The pairs of independent-dependent variables correlated
were evaluated for the complete time series and for reduced series
of cluster centroid-day, series of clustered days, and amended dichotomous
series (containing only 0 and 1 values: "1" corresponding
to the days with admissions, with the elimination of the single
daily admissions, isolated in time, "0" corresponding to the days
without admissions not occurring before or after an admission).
The regression coefficients for each regression were considered
significantly different from zero if there was a non-linear relationship
between the response variable and the regressor, verified using
a z-test under the hypothesis β=0 (regression coefficient equal to
zero). Moreover, the model provided also the p-value of the regression
and its degree of significance. To compare results of the Logistic
and Poisson models, the R 2adj corrected coefficient of determination
(defined as the proportion of total variation of the dependent
variable, explained by the independent variable and corrected for
the number of variables and the number of pairs of measured data)
was used. The basic model of multiple regressions was simi lar to
that of bivariate regression, the only difference being in the number
of predictor variables included in the model. The statistical analysis
allowed assessing whether and how much the predictor variables of
the model were able to estimate SP admissions. The meteo-chemical
variables and the time series were the same used in the bivariate
analysis. The regression coefficients were evaluated and their significance
was assessed through a z-test; the adequacy of the regression
model was established through the Akaike Information Criterion
(AIC). 2 R is a free software environment for statistical computing and graphics. It compiles and runs on a wide variety of UNIX platforms, Windows and MacOS.
http://www.r-project.org/.
|
|
Results
Seasonal analysis and SP occurrence
There were 363 non-null events (days with SP admissions), with
a maximum of 6 events in 4 different days. The events tended to group in the years 2003, 2004 and 2005. The summer showed the
lowest number of events, while in the other seasons the events had
approximately the same frequency. The monthly distribution of the
events showed minima in July and November, and maxima in October
and April. Thus, in this study, SP did not appear to be linked
to specific monthly, seasonal and annual periodicities, as also
founded by Bulajich B et al ( 4), Smit HJ et al and Alifano M et al
( 5, 6); on the contrary, Suarez-Varel MM et al reported a significant
increase in admissions in May and December, a fall in January,
and a higher frequency of SP events in spring ( 2).
Analysis of the time series
Distribution of daily number of admissions was apparently similar
to that of a Poisson distribution. The comparison of the frequencies
of the SP event distribution and of those obtained with theoretical
model of a Poisson distribution was evaluated with a χ 2 test,
which demonstrated that frequencies of SP data did not fit with a
Poisson distribution at the p = 0.01 significance level: the Poisson
distribution possessed a fewer number of rare cases (number of
daily events greater than 4) than the experimental series. Accordingly,
these results seemed to demonstrate that series of SP events
was not random. The temporal autocorrelation was studied by creating
new series, in which a time lag was set varying from 1 to 100
days, which were compared with the original one. Coefficients of
the Autocorrelation Function (ACF) were studied as function of
time lags, taking into account the upper and lower values of confidence
interval ( Fig 1). All autocorrelation coefficients but one resulted
significantly equal to zero (at the confidence level p = 0.01),
and only that corresponding to a time lag of 5 days was significant.
Therefore, this analysis suggested that there was a certain probability
that two days with SP events are related to each other if they occurred
within 5 days. This result was confirmed by spectral analysis,
in which the power spectrum of sequence of data was estimated using the method of the non-parametric periodogram. The significance
of the various peaks was tested by comparing each value
of the spectral density with the spectra of white and red noise, the
significant (at the level p 0.001) peaks corresponding to 2, 5 and
64 days ( Fig 2). Through the method of cluster analysis, effective
clustering of most of SP events was verified: considering a range
between 2 subsequent admissions of 2 or more days, the 81% of
the days with SP admissions was clusterized. Increasing this range
to 3 days, the percentage of clusterization increased to 85% (88%)
( 4). Applying the same technique to series with a Poisson distribution
and to synthetic series obtained by making a temporal rearrangement
of SP events, the clustering percentages obtained were
lower than those of the actual series; a test on the difference between
a couple of distributions at the significant level of p = 0.01
confirmed that series of SP events was not similar to that of a Poisson
distribution, and that the SP events were not distributed randomly.
Meteo-chemical features of pneumothorax and non-pneumothorax
days
For each meteo-chemical variable, the contributions referred to
SP days and non-SP days were considered separately. SP and
non-SP series were constructed with the help of a dichotomous
modified series, in order to clean up the series by removing SP cases
that could be affected by non-SP cases, and vice versa. Concerning
the meteorological parameters, the following series of SP and
non-SP resulted significantly different at the level of confidence p
= 0.05: ΔU- (Wilcoxon test) and WS minimum (t-Student and
Wilcoxon tests). At p = 0.01 confidence level, all couples of series
resulted significantly equal. Series of pollutant concentrations were
analyzed in the same way, showing that, at p = 0.05 confidence
level, the following series of SP and non-SP resulted significantly different: CO minimum and NO2 minimum (t-Student and Wilcoxon
tests),Δ and σ of C6H6 (Kolmogorov-Smirnov and Wilcoxon
tests), and O3 minimum (Wilcoxon test).
Bivariate and multivariate regression analysis
The non-linear bivariate regression showed many coefficients
significantly different from zero, particularly for atmospheric pollutants
and for the complete and the dichotomous modified series.
The non-linear model showing the greatest value of R 2adj corrected
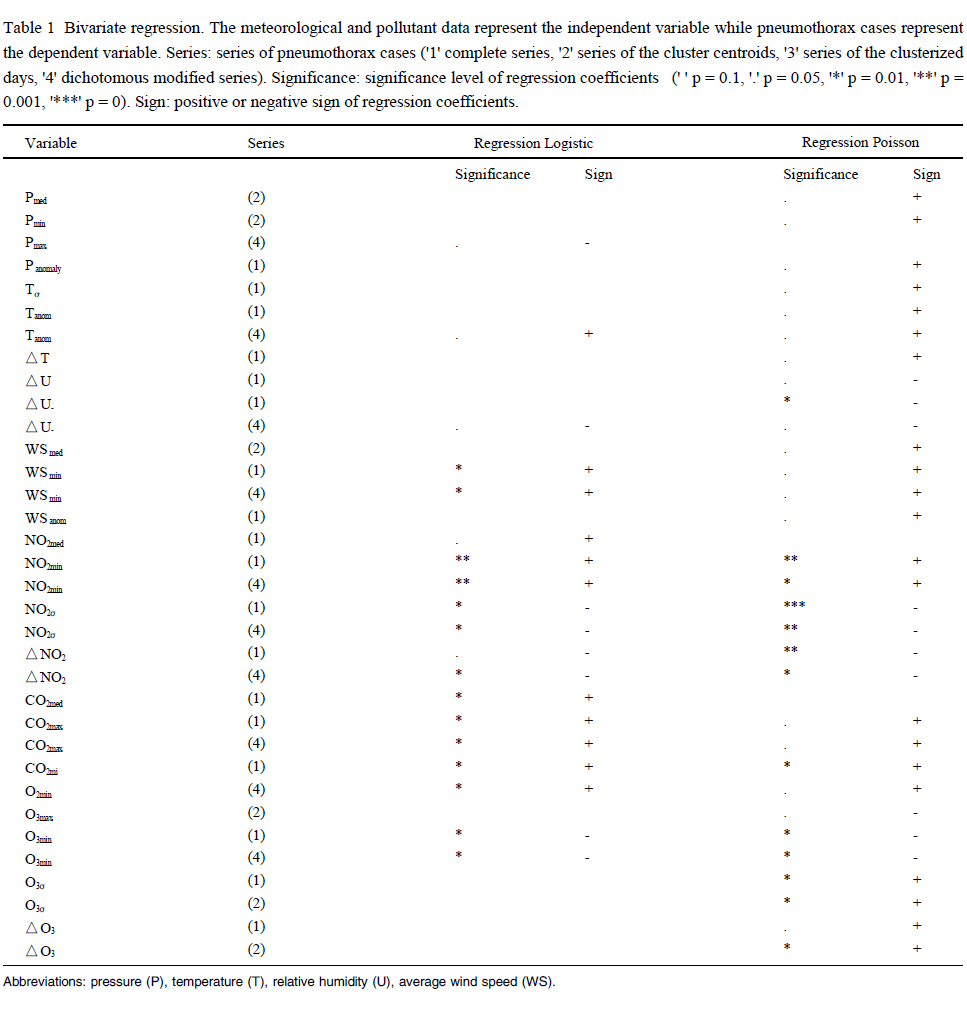
was the logistic one. Significant predictors of meteorological variables
according to logistic model were ( Table 1): at confidence
level p = 0.01, daily WS minimum (complete and dichotomous
modified series); at confidence level p = 0.05, P maximum (dichotomous
modified series), daily anomalies of T (dichotomous
modified series) and Δ-U (dichotomous modified series). Thus, although
some authors argued that sudden changes in pressure can
be an important cause for occurrence of SP (Scott GT et al reported
that only one patient with SP out of 4 in their series was exposed to
significant pressure variations in the 4 days prior to admission in
hospital ( 1)), in this study, correlation between pressure variations
and SP was not substantiated, indicating that probably there are
other causative factors leading to a SP event 3. Moreover, in this setting,
relative humidity and temperature were not clearly linked to
SP events, contradicting findings by Bulajich B et al and Smit HJ
et al showing a slight temperature increase in the days preceding
the admissions 4 ( 4, 5). Significant predictors of atmospheric pollutants
according to logistic model were ( Table 1): daily NO 2 minimum
(full and dichotomous modified series) at p = 0.001 confidence
level, daily σ and Δ NO 2, CO 2 daily maximum and minimum,
O 3 daily minimum (dichotomous modified series), daily
mean CO 2 (complete series) at p = 0.01 confidence level, and daily
and mean NO 2 (complete series) at p = 0.05 confidence level. The
study of Celenza A et al outlined the correlation between thunderstorms
and asthma exacerbations ( 9). Since asthma and SP are
characterized by similar inflammatory broncho-alveolar changes, it
is possible that there could be similarities also between the factors
triggering the respective episodes. In addition to viral infections
and cigarettes smoke, already recognized to cause SP, other conditions,
such as high concentration of pollutants or continued exposure
to allergens, should be also taken into account. For this reason,
in the present study a multiple regression analysis, taking into account meteorological and chemical (pollutants) variable together,
was carried out. Logistic model provided best results (according
with AIC criterion). By calculating regression between logistic
variable (stepwise - regression) of SP admissions versus meteorological
variables, the output of the model indicated as significant
regressors the coefficient of daily minimum wind speed (p = 0.01)
and temperature (p = 0.05). In addition, model yielded a positive
coefficient in the first case and a negative one in the second. The
same regression analyses were repeated considering the pollutants
series. The highly significant predictors (p = 0.001) were the daily
mean and maximum O 3 and the daily minimum NO 2 and, with a
lesser significance (p = 0.01), the daily mean PM10 and the NO
daily maximum and minimum. At confidence level of p = 0.05, the
coefficients related to the daily maximum PM10 and CO 2 and to
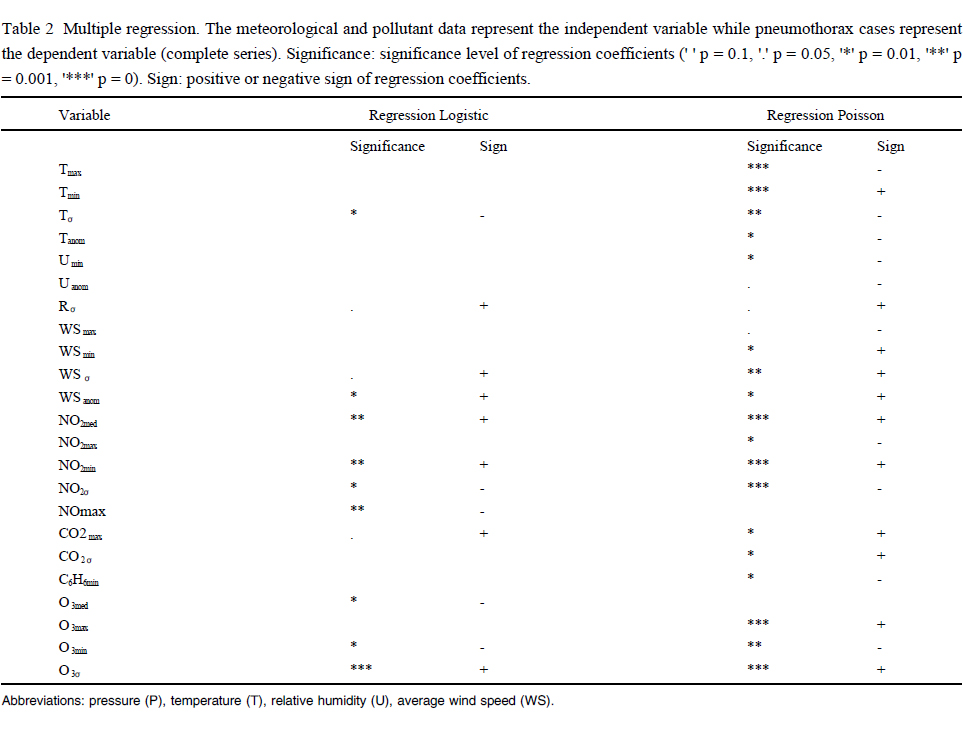
daily σ NO 2 were significant. As a further step, two models where
the regressor variables were both meteorological and chemical
( Table 2) was built. In the first, only the daily mean values, σ and
anomalies were considered, whereas, in the second, daily maximum
and minimum values were included. Regression analysis
showed a relationship between number of SP admissions and increase
of daily mean and minimum NO 2 (p = 0.001), decrease of
σNO 2 (p = 0.01), decrease of daily mean, minimum O 3 (p = 0.01)
and maximum NO (p = 0.001), and increase of daily σO 3 (p =
0.05). The maximum daily CO 2 concentration showed a significant
and positive coefficient (p = 0.05). The daily decrement of σT (p =
0.01) and increment of daily σR (p = 0.05) were also significant.
Finally, analysis also revealed that increment of WS anomalies and
minima (p = 0.01) and decrease of its σ(p = 0.05) could contribute
to SP onset. 3 There is also another reason to support this finding: as atmospheric pressure decreases with the increasing quote (approximately 1 hPa every 10 m at the
sea level), the typical daily pressure variations recorded in a place (1-2 hPa) are corresponding to quote variations of 10-20 m, which can be usually experienced by a person rising at the 3rd-6th floor of a building. And people living in hilly areas (some 200-300 m above urban areas) will experience pressure
variations much higher than the typical meteorological variations. As there is not any evidence of an anomalous number of SP cases corresponding to people
taking lifts or living in the hills, it is possible to deduce that pressure variations cannot be considered a relevant factor triggering a SP event.
4 In common life, sometimes persons are exposed to abrupt temperature variations very high (entering in a place with strong air conditioning during summer-time, or in a place heated during wintertime, or in a sauna) that exceed the usual temperature variations caused by meteorological factors, but there is not any
evidence of an anomalous number of SP events correlated with the above mentioned temperature variations, which supports the conclusions that temperature
variations does not influence SP events.
|
|
Discussion
SP is a medical emergency and first aid intervention is rapid; for
these reasons, this study took into account only the variables
recorded one day before the pneumothorax occurrence, instead of
assessing the performance of the variables in 3 - 4 previous days
(as has been done in the study of Alifano M et al ( 6), Suarez-Varel
MM et al and Bulajich B et al ( 2, 4)). This approach, due to the
short time for the breaking of the cellular structures, seems to be
better. The analysis of monthly, seasonal and annual distributions
had not found significant correlations between the insurgence of
pneumothorax and specific time periods. The season with the lower number of admissions was the summer, and the monthly distribution
suggested a preponderance of admissions during October
and December. Among the papers analyzed, that published by
Suarez-Varel et al have reported a significant increase in admissions
in May and December, and a fall in January ( 2); the seasonal
analysis of this paper has also reported a higher frequency of pneumothorax
events in the spring. On the contrary, other papers have
not found significant differences in the seasonal and monthly distribution
of admissions ( 4, 5, 6). A first clinical investigation revealed
that the admissions tend to occur in clusters. These results are in agreement
with previous analyses ( 2, 4, 5, 6). The fact that the admissions are clustered suggested the hypothesis that the meteorological
conditions (or some related factors) could play an important
role in the mechanism that leads to the development of pneumothorax.
The results of the autocorrelation and spectral analyses had
confirmed those obtained with the cluster analysis: the admissions
tend to aggregate temporally. This behavior could be due to the
hazard but, as there is not any reason to suppose this fact, an analysis
had been performed to check the dependence from some meteorological
and chemical variables. Some authors argue that sudden
changes in pressure can be an important cause for the occurrence
of pneumothorax. In this study, results that could provide a link between the pneumothorax events and pressure variations had not
been founded. It could be expected that the influence of significant
atmospheric pressure variations could be more efficient in a period
of long exposure, but the study of Scott GC et al reported that only
one patient over 4 was exposed to significant pressure variations in
the 4 days prior to the admission in hospital ( 1). This does not
mean that a sudden change of atmospheric pressure does not lead
to a pneumothorax event, but indicates that probably there are other
factors, whose influence cannot be evinced with this kind of
analyses. The temperature did not reveal clear links with the pneumothorax
events: at the increasing of the events, there was been a
decrease in daily anomalies and in the standard deviations (for the
bivariate regression). In the study of Smith HJ et al ( 5), a slight increase
in temperature has been observed in the days preceding the
admissions, and also the study published by Bulajich B et al confirms
this hypothesis ( 4). The relative humidity showed a small difference
between the minimum of a day and the maximum of the
previous day, both in the cases of pneumothorax and non-pneumothorax
events, and the bivariate regression analysis had confirmed
the existence of a relationship between the admissions and
different sets of variables correlated to the humidity. In the study of
Smith HJ et al ( 5), the correlation between the pneumothorax events and the occurrence of thunderstorms (when there are rapid
variations of the meteorological variables) on the day preceding the
admission has been shown. But, at a matter of fact, in this paper,
the results have indicated that the only significant meteorological
variable correlated with the pneumothorax onset is the minimum
wind speed. Often the conclusions of the papers on pneumothorax
occurrence were not homogeneous, and the comparisons between
different approaches are difficult because the definitions of the assumptions
are also different. Moreover, many studies involving
few patients and generally involve countries with different climatic
conditions. In the study of Celenza A et al, the correlation between
thunderstorms and cases of asthma reinforcements has been reported
( 9). Because asthma, with respect to pneumothorax, is characterized
by similar inflammation, it is possible that there could be
similarities also between the factors that could trigger the crisis of
pneumothorax and asthma. Although viral infections and smoke
cigarettes are recognized as factors able to unleash the pneumothorax,
also many other factors, including pollutants concentrations or
exposures to allergic substances should be taken into account. The
results of the mentioned study, with regard to atmospheric pollutants,
has led to the same meteorological phases resulted unfavorable
for the pneumothorax cases already reported in Bulajich B et al ( 4). As said before, asthma and pneumothorax share common
patho-physiological mechanisms. For this reason, in the present
study a multiple regression analysis, taking into account the meteorological
and chemical (pollutants) variable together, was carried
out.
|
|
Conclusions
Statistical analysis of the SP events collected at Turin, Italy,
during 5 years showed that most of them were clusterized, supporting
thus the idea that there could be a triggering factor enhancing
the insurgence of SP. The series of SP events and meteo-chemical
observations were thus analyzed using non-linear bivariate and
multiple regressions. Occurrence of SP appears to be significantly
facilitated by higher and less dispersed values of daily mean NO2,
by lower and more dispersed values of O3, and by less dispersed
temperature and wind speed values. Other correlations, as those
with large CO2 maxima and during cold and windy days, appeared
less significant.
|
|
Acknowledgements
The authors would like to thank ARPA Piemonte for the meteo-
chemical data, Francesca Fissore for the extraction of the meteorological
datasets and for the development of the statistical analysis
of the SP distribution during her bachelor thesis in Physics at
the University of Turin, Italy. The authors want also to thank the
Directions of A.S.L. TO2 - Torino Nord Hospitals of Turin (where
Dr. Bertolaccini worked, as Consultant, until 2009), Italy, for having
provided, in anonymous form, the data regarding the admissions
of the SP patients. Finally, the authors are thankful to Dr.
Giuseppe Migliaretti and Dr. Paola Berchialla for their kind suggestions.
|
|
References
-
Scott GC, Berger R, McKean HE. The role of atmospheric pressure variation in the development of spontaneous pneumothoraces. Am Rev Respir Dis 1989;139:659-62.
[LinkOut]
-
Suarez-Varel MM, Martinez-Selva MI, Llopis-Gonzalez A, Martinez-Jimeno JL,Plaza-Valia P. Spontaneous pneumothorax related with climatic characteristics in the Valencia area (Spain). Eur J Epidemiol 2000;16:193-8.
[LinkOut]
-
Bense L. Spontaneous pneumothorax related to falls in atmospheric pressure. Eur J Respir Dis 1984;65:544-6.
[LinkOut]
-
Bulajich B, Subotich D, Mandarich D, Kljajich RV, Gajich M. Influence of atmospheric pressure, outdoor temperature, and weather phases on the onset of spontaneous pneumothorax. Ann Epidemiol 2005;15:185-90.
[LinkOut]
-
Smit HJ, Devillé WL, Schramel FM, Schreurs JM, Sutedja TG, Postmus PE. Atmospheric pressure changes and outdoor temperature changes in relation to spontaneous pneumothorax. Chest 1999;116:676-81.
[LinkOut]
-
Alifano M, Forti Parri SN, Bonfanti B, Arab WA, Passini A, Boaron M, et al. Atmospheric Pressure Influences the Risk of Pneumothorax: Beware of the Storm!Chest 2007;131;1877-82.
[LinkOut]
-
Abbey DE, Petersen FF, Mills PK, Beeson WL. Long-term ambient concentrations of total suspended particulates, ozone, and sulfur dioxide and respiratory symptoms in a non-smoking population. Arch Environ Health 1993;48:33-46.
[LinkOut]
-
Abbey DE, Hwang BL, Burchette RJ. Estimated long-term ambient concentrations of PM10 and development of respiratory symptoms in a nonsmoking population.Arch Environ Health 1995;50:139-50.
[LinkOut]
-
Celenza A, Fothergill J, Kupek E, Shaw RJ. Thunderstorm associated asthma: a detailed analysis of environmental factors. Br Med J 1996;312:604-7.
[LinkOut]
-
Abbey DE, Burchette RJ, Knutsen SF, Donnell WF, Lebowitz MD, Enright PL. Long-term particulate and other air pollutants and lung function in nonsmokers.Am J Respir Crit Care Med 1998;158:289-98.
[LinkOut]
-
Boezen M, Schouten J, Rijcken B, Vonk J, Gerritsen J, van der Zee S, et al. Peak Expiratory Flow Variability, Bronchial Responsiveness, and Susceptibility to Ambient Air Pollution in Adults. Am J Respir Crit Care Med 1998;158:1848-54.
[LinkOut]
-
Chitano P, Hosselet JJ, Mapp CE, Fabbri LMl. Effect of oxidant air pollutants on the respiratory system: insights from experimental animal research. Eur Respir J 1995;8:1357-71.
[LinkOut]
-
Osunsanya T, Prescott G, Seaton A. Acute respiratory effects of particles: mass or number? Occup Environ Med 2001;58:154-9
[LinkOut]
Cite this article as: Bertolaccini L, Alemanno L, Rocco G, Cassardo C. Air pollution, weather variations and primary spontaneous pneumothorax. J Thorac Dis 2010;2:9-15. doi: 10.3978/j.issn.2072-1439.2010.02.01.018
|


