
Pleural pressure theory revisited: a role for capillary equilibrium
Introduction
Pleural fluid exists as a thin film under sub-atmospheric pressure, in the range of 5 cm water pressure (1), and is even lower than atmospheric pressure at the lung apex compared to the base (2).
Pleural fluid acts as a lubricant reducing lung friction at the surface (3). The vertical gradient of pressure within the pleura is less than predicted from its hydrostatic pressure (4). There occurs a circulation of pleural fluid with fluid exudation from the parietal pleura and fluid absorption occurring maximally at the parietal pleura basally, at the mediastinal pleura (5).
The explanation for these pleural fluid phenomena has been controversial with various models proposed. These include hydrostatic equilibrium (6,7), viscous flow (4,8) and pleural pumping (9-12). These models have specific predictions regarding how pleural pressure is developed. Contrary to the hydrostatic model, experimental evidence shows that the vertical pressure gradient in the pleural space is less than 1 cmH2O/cm height; though proponents claimed that points of contact between the pleural surfaces reduced lung surface pressures, thus explaining pleural pressures (13).
In the viscous flow model, Lai-Fook states that the “surface pressure expanding the lung, equal and opposite to the pressure expanding the chest wall, is transmitted hydraulically across the pleural space with the surface pressure equal to the pleural liquid pressure, and is the major determinant of the pleural liquid pressure. The difference between the vertical gradient in pleural surface pressure and the hydrostatic value drives a viscous flow of pleural liquid downward in the pleural space, which has no pleural contact” (14). The viscous flow model excludes the presence of a hydrostatic equilibrium and also omits capillary pressures, relying only on transmural pressures generated by the equal and opposing recoils of the lungs and the chest walls.
The pleural lymphatic vessels over the lower parts of parietal pleura have open stomas that drain pleural fluid directly into the lymphatics, where it is actively pumped by smooth muscle in the lymphatic walls aided by skeletal muscle contraction (15). A requirement of the pleural pumping model is that active pumping directly causes the negative pleural pressure (11). However, pumping to such a degree of negative pressure is energy consuming and would probably lead to fluid being drawn across the pleural membranes.
Examples of capillary action are common in nature. For example, when a brush is dipped in water, surface tension forces cause the hairs in the brush to coalesce. Surface tension is the elastic tendency of a fluid surface to acquire the lowest surface-area possible, and is due to the greater attraction or cohesion of water molecules to each other through hydrogen bonds, rather than adhesion to other molecules. Surface tension forces exist without the need for air, for example in capillaries (xylem) in plants and trees. The contact angle is the mean of a range of angles (contact angle hysteresis between advancing and receding contact angles) at which a liquid or vapour meets and is in equilibrium with a solid. The contact angle reflects the strength of the molecular attraction, and allows calculation of surface tension forces.
A model that covers all known facts about pleural pressures, but avoids the pitfalls mentioned above, has not yet been proposed. The concept of capillary forces in the pleural space is attractive since it would immediately imply that pleural pressure is negative and maximal at the apex due to capillarity, that lung and chest wall recoil is equal and opposite, and the concept of flexo-capillarity (capillarity between flexible sheets) implies that contact may be both present and absent (16).
The aim of our theoretical model was the evaluation of the physics of the pleural space in the light of the capillary action that occurs in thin films of fluid between conforming surfaces, assuming equilibrium between the hydrostatic, buoyancy and capillary forces at all levels, with the lung floating in pleural fluid following Archimedes’ hydrostatic paradox. To clinically test this hypothesis, the capillary equilibrium model was used as a prediction model in the scaling of pleural pressures with body size, in the development of pleural effusions, and to assess post-lobectomy temporary pleural pressure changes.
Methods
Mathematical analysis of capillary surface interaction aimed at calculating pleural pressure was performed. A systematic literature search was performed. We searched three bibliographic databases (MEDLINE, EMBASE, and the Cochrane Central Register of Controlled Trials) from inception (MEDLINE, 1946; EMBASE, 1974; and Cochrane Central Register of Controlled Trials, 1898) to 1st December 2015, without language restriction. An extensive search strategy using a combination of subject headings (“surface tension”, “contact angle”, “pleura”, “peritoneum”) was constructed to find articles with data about surface tension and contact angles required to calculate capillary forces.
According to previous models, the chest wall was shaped as a wetted surface with consistent physical characteristics, and the lung simplified as a homogenous (17), floating substrate with a contact angle equal to that of the chest wall as all pleural surfaces have a phospholipid coating (18). The lung was modelled as floating according to Archimedes’ hydrostatic paradox (an object with an average density lower than its surrounding fluid can float in a quantity of fluid with less volume than the object itself) (19). The equilibrium of contact across the pleura was modelled as the capillary interaction of near parallel surfaces balanced against buoyancy pressure. An assumption of static equilibrium in the pleural space was made, so the effects of cardiac and respiratory movements on the pleural space were disregarded. The shapes of the lungs and chest wall were taken to be confluent, apart from the borders of the lobes of the lung.
Results
Buoyancy
The lung is assumed to be floating in the pleural fluid according to Archimedes’ hydrostatic paradox. The density contrast between the lung and pleural fluid forms the hydrostatic gradient for pleural fluid (Figure 1) (20):


where g is the acceleration due to gravity, h is the vertical height, and ppleural fluid, plung are the densities of pleural fluid and lung respectively. In this paper, a value of 0.32 g/mL was taken for lung density and 1.025 g/mL for pleural fluid density, with further details shown below.
Lung density or specific density varies in the literature with values ranging from 0.14 g/mL [data on lung mass from Molina et al. (21) and on lung volume from Stocks et al. (22)] and 0.25–0.37 g/mL [data from Garnett et al. (23)]. Normal pleural fluid has a protein concentration of approximately 15 g/L (24), corresponding to a density of 1.034 g/mL (25), but a pleural fluid density of 1.025 g/mL (range, 1.020–1.030 g/mL) has also been reported (26).
There is also a range of values between the differing pleural fluid and lung densities, resulting in a liquid pressure gradient in the pleural space of approximately 0.775 cmH2O/cm height (subtracting 0.250 from 1.025) above lung base when pleural surfaces are confluent. There is however an even wider range of variation in lung and pleural fluid densities in pathological states (Table 1) (23,26) resulting in a wide range of pressure gradients from 0.1–0.9 cmH2O/cm height that matches the range of experimental measurements of the vertical pressure gradient within the pleural space (Table 2) (8,14).

Full table

Full table
Equilibrium
The forces acting on the pleural fluid and lung interface are assumed to be in equilibrium, with the lung displacing pleural fluid, and capillary forces retaining a film of pleural fluid (40). The force generated by the weight of the elevated pleural fluid acting against the lung is balanced by the negative pull of the surface tension forces at all levels and the buoyancy pressure generated by the lung floating in the pleural fluid (Figure 1). With the assumed occurrence of equilibrium:

Calculation of capillary pressures and pleural fluid thickness
Confluent plates are pressed together with a capillary force F (41):
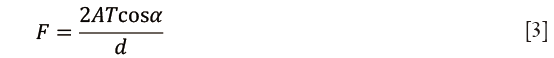
where A is the area of contact of the film, d is the distance between the plates at the edge of the film, α is the contact angle between the fluid and the solid, and T is the surface tension of the liquid.
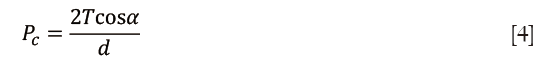
Since pressure is force over area, then capillary pressure (Pc):
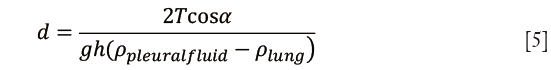
Pleural fluid thickness was calculated by substituting from formula (1):
Capillary pressure and hydrostatic pressure calculations were performed using the following parameters: specific gravity of pleural fluid 1.025, pleural fluid contact angle 38°, surface tension of 18 dynes/cm and relative density between the lung and pleural fluid 0.775 g/cm3.
The pleural fluid contact angle of 38° was based on the mean contact angle of a phospholipid extract coated surface of 38.2°±4° (42), contact angle of phosphatidylcholine coated slide of 40° (43), contact angle of lipid-extract-coated slide of 32° (43), and a parietal peritoneal contact angle of 43° and visceral peritoneal contact angle of 47° (44). Surface tension of pleural fluid was assumed to be 18 dynes/cm based on the surface tension of a phospholipid extract of 20±3.4 dynes/cm (42), the surface tension of ten lipid extract samples of 17.2±2.3 dynes/cm (20), direct measurements of surface tension in the lung (45) ranging from 9–20 dynes/cm, and peritoneal surface tension of 17 dynes/cm (43), see Table 3; in contrast, the surface tension of pure water at 37 °C is 74.27 dynes/cm.

Full table
The range of pleural pressures was calculated using relative density 0.65–0.89 g/mL, contact angle 32°–47°, and surface tension 15–23 dynes/cm and reported in Table 4. The predicted range of thickness of pleural capillary film against the height of the fluid showed an asymptotic behaviour (Figure 2), see Eqs. [7] and [8] below. For example, using the mean values of this paper, at a height above lung base of 10 cm, the capillary pressure would be 7.75 cmH2O (Table 4). This calculation approximates well with Lai-Fook’s work on the difference in pleural pressure between lobar margins and costal surfaces in dogs (4) (Figure 3), where at 10 cm above lung base, the difference in pleural pressure between the lobar margin and costal surface was 7 cmH2O.

Full table


The capillary equilibrium model suggests several speculative predictions that could support the validity of this theory.
Scaling with size
In large animals, the vertical height of the lungs would result in a thin pleural film with a high tendency to collapse because of elastocapillary forces: this collapse of the pleural film may be expected over an extended period of time to result eventually in fibrosis of the pleural space, especially apically. This may be an alternative explanation to West’s answer that elephants developmentally obliterate the pleural space, extant in the foetal stage (46), to protect the parietal pleural microvasculature (47).
Effect on development of pleural effusions
The pleural fluid contains protein at a lower level than serum. The higher the protein content, the lower the surface tension of water, and the higher the capillary forces. Lower protein levels result in a drop in capillary forces, which may lead to a lack of adhesion of lung to chest wall with resultant formation of a fluid collection. The phospholipid coating on the pleural surface generates a similar effect on lowering surface tension. Since capillarity and buoyancy pressure are assumed to be in equilibrium:
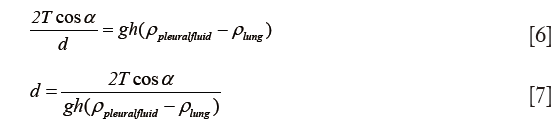
The pleural fluid thickness is proportional to surface tension (T) and the cosine of the contact angle (cos α), and inversely proportional to buoyancy (the difference in densities).
As the protein content in pleural fluid decreases, the surface tension (T) increases (more hydrophobic) according to formula (8), so pleural fluid thickness increases are encouraging the formation of a transudate effusion: d ∝ T.
From formula (8), the thickness of pleural fluid is inversely proportional to the difference in lung and pleural density, or buoyancy:
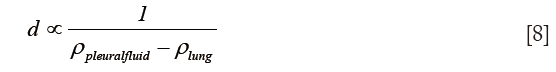
From Table 1, it is evident that lung buoyancy is maximal in emphysema, suggesting that pleural effusions should not develop in emphysema, where the thickness of pleural fluid should be minimal. This explains why pleural effusions developing in emphysema patients occur only with concomitant congestive heart failure (48), which would decrease buoyancy of the lung and increase pleural fluid thickness. Tight control of the volume and protein content of pleural fluid is required to allow an adequate connection between the lung and the thoracic wall (8). Pathological changes in lung and pleural densities (Table 1) can substantially affect pleural pressure and thickness measurements by altering the equilibrium between capillarity and buoyancy hydrostatic pressure.
Contact between the parietal and visceral pleura
The previous hydrostatic equilibrium model required areas of contact between the parietal and visceral pleura (49), while the viscous flow model postulated the existence of points of contact between the two pleural surfaces possibly through cells present in pleural fluid and microvilli (1,2,14,50). The model described here can work with both the presence and lack of areas of contact; classical capillarity assumes no contact up till a height as predicted by Jurin’s law (that represents the height of rising of a liquid in capillary tubing), but elastocapillarity allows contact between pleural surfaces due to the flexible visceral pleura (51).
Assumptions in model
Lung density was assumed to be uniform, however at the lung base, some areas may act similar to West zone 4, with increased density due to the collapse of the lung structure under its weight. The changes in lung density are partly gravitational, partly due to pressure from the heart and partly by patterns of blood flow within the lung, since blood makes up about 50% of the lung’s weight (17,52,53). The values of the contact angle and surface tension were taken as an average and constant at all points. We also assumed that the protein concentration (which affects the surface tension) is constant throughout the pleural fluid. Static equilibrium in the pleural space and the confluent shape of the lung against the chest wall were other assumptions. The equations used assume the presence of an infinitely small of air in the pleural cavity and are approximations, accurate on flat surfaces whilst the lung is curved.
Discussion
Any theory for pleural pressure needs to explain certain crucial facts, including that the lung and chest walls exert an equal and opposite recoil pressure (54). It would need to explain the negative values for pleural pressure, and why apical pleural pressure is more negative than at the base. It would also require an explanation for the lower than expected pleural hydrostatic pressure gradient that differs from the hydrostatic pressure gradient at the lobar margins in confluent pleural space, as well as a mechanism explaining how pleural circulation occurs.
In the capillarity equilibrium model, pleural forces press the lung and chest wall together by negative capillary forces, passively based on the molecular attraction of solids and liquids. When ventilation is paused at functional residual capacity, there exists a state of equilibrium. Capillarity develops equal and opposite forces in the chest wall and lung explaining how the reactive forces on the lung and chest wall are equal and opposite. Since the lung is more compliant than the chest wall, capillary forces act to conform the lung to the parietal pleura. The recoil of the lung from the chest wall occurs when the high capillary forces are disrupted in a pneumothorax or hydrothorax.
The pleural fluid, whose volume and composition is tightly controlled by the metabolically-active pleural mesothelial cells (55), yet varies in pathological states, acts as a thin film creating capillary interaction. This model postulates that pleural fluid causes adhesion, effectively coupling lung and chest wall, precisely because the volume of pleural fluid is kept low by active pumping. The pumping action of the chest wall mesothelial cells is necessary to maintain a minimal pleural fluid volume (12,56) and thus support capillary forces in the pleura, which would be lost if the fluid was allowed to accumulate. The capillary forces generate a negative pressure gradient that is maximal at the apex, where the pleural fluid film is thinnest. This proposed model explains the negative value for pleural pressure (57), and why this is maximal at the apex (14).
Why the hydrostatic vertical pleural pressure gradient is higher at pleural borders
The hydrostatic fluid gradient in the pleural space is altered by the presence of lungs that are buoyant in pleural fluid, changing the relative hydrostatic pressure gradient of the pleural fluid. At every level of the pleura, the capillary forces are in balance with the hydrostatic buoyancy force exerted by the lung floating in pleural fluid, based on the relative densities of pleura and lung. This is similar to the contact problem between two immiscible liquids of different densities such as oil and water, as occurs with buoyancy forces in reservoir fluids (20).
Modelling can explain the issue of the less than expected hydrostatic vertical pleural pressure gradient for buoyancy forces between the pleural fluid and the lung floating in the pleural fluid according to Archimedes’ hydrostatic paradox; the solution sketched here is based solely on this explanation. The previous comment by Agostoni (49) that pleural contact occurs is feasible according to the modern theory of flexo-capillarity (16). With flexible walls, the contact between opposite walls enables the liquid to rise virtually to infinity (51).
As a film of pleural fluid exists at the apex (14), the lung can be assumed to be submerged and floating in pleural fluid in a state similar to Archimedes’ hydrostatic paradox. The volume of pleural fluid remaining at a given height in the pleural space is a function of the balance of capillary forces pulling the pleural fluid up and the force of gravity acting together with the density contrast between the lung and pleural fluid, operating to remove the pleural fluid down (40). The capillary-bound pleural fluid comprises a continuous column of pleural fluid, which will have a pressure gradient controlled by the pleural fluid density. The lung will have a pressure gradient controlled by the (lower) lung density (Figure 2). Although lung and pleural fluid coexist in the same localised pleural space, the forces acting on the two are different. The difference in pressure between the lung and pleural fluid increases with height above the free-pleural-fluid level; the free-pleural-fluid level being the level at which the lung pleural fluid interface would theoretically stand in the presence of air (58), with only gravity and buoyancy forces controlling pleural fluid level in this situation. The relationship between capillary and buoyancy forces thus monitors the thickness of the pleural fluid film within the pleural space (20). The lung will float fractionally higher than expected (even though the same total volume of pleural fluid would have been displaced) as in a state of equilibrium, the buoyancy and surface tension forces are equal to the weight of displaced fluid.
At the level of the lobar borders, the lung is not confluent with the chest wall, so there is no thin film arrangement, and capillary forces are much weaker. In this case, the column of fluid acts hydrostatically with a pressure change akin to a manometer with an increase of 1 cmH2O as one moves 1 cm further inferiorly.
Pleural fluid circulation
The formation of pleural fluid is due to exudation mostly from the parietal pleural surface and is absorbed by the diaphragmatic and mediastinal parietal pleura (54). The capillary equilibrium model suggests that the higher rate of pleural fluid formation in the apex is due to the greater negative capillary forces there, resulting in a flow of pleural fluid to the relatively lower-producing areas in the base. The heart acts as a pressure chamber within another pressure chamber, the thorax. Pleural pressure varies from −5 cmH2O at the bottom to −15 cmH2O at the apex whilst pericardial pressure ranges from −10 to +5 cmH2O depending on the stage of the cardiac cycle (59), with pericardial pressures increasing with faster heart rates as occurs with exercise in healthy hearts (60). The high negative apical pleural pressure leads to a basal-to-apical gradient that is effectual only at the mediastinal pleural surface since cardiac motion is only efficient as a pump at the mediastinal surface. An increase in the heart rate is associated with an increase in contractility of the myocardium; at higher heart rates, the diastolic time decreases, so the effective pressure generated within the pericardium rises towards the maximum of +5 cmH2O (61). This increases the forward gradient and causes increased pumping particularly at the lobar edges where the lack of confluence between lung and chest wall allows pleural fluid to be easily disturbed by cardiac contractions and the motions of breathing (ventilator pump), and where the capillary forces are greatly diminished, leading to a fluid flow directed up towards the apex. Absorption occurs into parietal and diaphragmatic lymphatic stomata (62) with those at the level of the diaphragmatic pleura (3) driven by diaphragmatic contraction (15).
Deep respiration with descent of the diaphragm and increase in the thoracic volume makes the intra-thoracic pressure more negative. Intra-pleural pressure is subject to the same change in pressure as measured by intra-esophageal balloon catheter pressure measurements. All this implies that the capillary equilibrium model is consistent with known physiology (14).
Post-lobectomy temporary intrapleural pressure changes
After a lobectomy, there is lung volume loss leading to a temporary increased pleural space that is initially free of fluid but eventually fills with pleural fluid, but with loss of the capillary component of pleural pressure. Pleural pressures in the initial post-operative period measure pleural air pressure with large volume swings, but pleural pressure becomes negative with lessening volume swings as space fills with fluid (63). Once the pleural space fills completely with fluid, the pleural pressure becomes more negative as the pleural space becomes non-confluent, similar to the normal circumstances at the lobar edge where the pleural pressure gradient is higher. The greater the non-confluence between the lung and the chest wall, the more negative the pleural space due to the absence of capillarity (Figure 3). Pleural pressures are higher with an upper lobectomy and normal in the case of a lower lobectomy (64,65). The temporary presence of more apical fluid after an upper lobectomy leads to loss of capillarity since the remaining lower lobe fits imperfectly in the pleural cavity, explaining the higher pleural pressures post-upper lobectomy and the normal ones post-lower lobectomy. Once confluence between the lower lobe and the apex develops, the pleural fluid physiology returns back to normal.
Pathological conditions
Pathological conditions such as emphysema, edema or fibrosis may alter the elastic property of the pulmonary parenchyma. For example, lung fibrosis causes hyperinflation of the lungs. This in turn results in coalescence of the pleural surfaces resulting in a change in the height of capillary rise when compared to normal lungs that can be modelled mathematically by elastocapillarity theory.
Pathology in the form of pleural effusions may also have an effect on this proposed model. Transudative effusions due to heart failure, cirrhosis and nephrotic syndrome etc., occur when there is excessive pleural fluid production exceeding the active resorptive capacity; on the other hand, exudative effusions occur when pleural leaks occur due to pleural damage from trauma, infection, malignancy etc. (3). In both cases the active pleural pump is overwhelmed with the increase in pleural fluid thus diminishing the capillary effect.
Conclusions
Capillary action attracts the parenchymal pleura to the parietal pleura. This force is a passive one, in that it does not entail the use of energy, and results in equal and opposite recoil forces in the lung and chest and is maximal at the apex. This model describes capillary forces as being in equilibrium with hydrostatic and buoyancy forces at all levels. Archimedes’ hydrostatic paradox explains buoyancy forces at confluent costal surfaces and the variation at lobar margins. This hypothesis predicts that pleural effusions cannot occur in pure emphysema; explains pleural pressure changes post-lobectomy; and is consistent with cardiac pumping setting up an upward flow of fluid in the mediastinum along an active pressure gradient. Pathological changes in pleural fluid composition and lung density alter the equilibrium between capillarity and buoyancy hydrostatic pressure to promote pleural effusion formation.
Acknowledgements
The authors would like to thank the University of Malta for partly supporting this research.
Footnote
Conflicts of Interest: The authors have no conflicts of interest to declare.
Ethics Statement: All results reported in this study are based on referenced work and the authors did not seek ethics approval since no experiments were carried out for this study and no participants were enlisted.
References
- Agostoni E, Miserocchi G, Bonnani MV. Thickness and pressure of the pleural liquid in some mammals. Respir Physiol 1969;6:245-56. [Crossref] [PubMed]
- Agostoni E, D’Angelo E. Thickness and pressure of the pleural liquid at various heights and with various hydrothoraces. Respir Physiol 1969;6:330-42. [Crossref] [PubMed]
- Miserocchi G. Physiology and pathophysiology of pleural fluid turnover. Eur Respir J 1997;10:219-25. [Crossref] [PubMed]
- Lai-Fook SJ. Mechanics of the pleural space: fundamental concepts. Lung 1987;165:249-67. [Crossref] [PubMed]
- Butler JP, Huang J, Loring SH, et al. Model for a pump that drives circulation of pleural fluid. J Appl Physiol 1995;78:23-9. [PubMed]
- Agostoni E, Taglietti A, Setnikar I. Absorption force of the capillaries of the visceral pleura in determination of intrapleural pressure. Am J Physiol 1957;191:277-82. [PubMed]
- Setnikar I, Taglietti A, Agostoni E. La cinetica del liquido 209. pleurico studiata per mezza di albumina marcata con 131L. Boll Soc Ital Biol Sper 1957;33:1650-3. [PubMed]
- Lai-Fook SJ, Rodarte JR. Pleural pressure distribution and its relationship to lung volume and interstitial pressure. J Appl Physiol 1991;70:967-78. [PubMed]
- Miserocchi G, Negrini D. Contribution of Starling and lymphatic flows to pleural liquid exchange in anesthetized rabbits. J Appl Physiol 1986;61:325-30. [PubMed]
- Miserocchi G, Negrini D, Mukenge S, et al. Liquid drainage through the peritoneal diaphragmatic surface. J Appl Physiol 1989;66:1579-85. [PubMed]
- Negrini D, Ballard ST, Benoit JN. Contribution of lymphatic myogenic activity and of respiratory movements to pleural lymph flow. J Appl Physiol 1994;76:2267-74. [PubMed]
- Negrini D, Pistolesi M, Miniati M, et al. Regional protein absorption rates from the pleural cavity in dogs. J Appl Physiol 1985;58:2062-7. [PubMed]
- Lai-Fook SJ, Beck KC, Southorn PA. Pleural liquid pressure measured by micropipettes in rabbits. J Appl Physiol 1984;56:1633-9. [PubMed]
- Lai-Fook SJ. Pleural mechanics and fluid exchange. Physiol Rev 2004;84:385-410. [Crossref] [PubMed]
- Moriondo A, Solari E, Marcozzi C, et al. Lymph flow pattern in pleural diaphragmatic lymphatics during intrinsic and extrinsic isotonic contraction. Am J Physiol Heart Circ Physiol 2016;310:H60-70. [Crossref] [PubMed]
- Kim HY, Mahadevan L. Capillary rise between elastic sheets. J Fluid Mech 2006;548:141-50. [Crossref]
- Tawhai MH, Nash MP, Lin CL, et al. Supine and prone differences in regional lung density and pleural pressure gradients in the human lung with constant shape. J Appl Physiol 2009;107:912-20. [Crossref] [PubMed]
- Hills BA. Graphite-like lubrication of mesothelium by oligolamellar pleural surfactant. J Appl Physiol (1985) 1992;73:1034-9. [PubMed]
- Koehl GM. Archimedes’ Principle and the Hydrostatic Paradox-Simple Demonstrations. Am J Phys 1949;17:579-80. [Crossref]
- Shepherd M. Reservoir fluids. In: Shepherd M, editor. Oil field production geology. AAPG;2009:29-35.
- Molina DK, DiMaio VJ. Normal organ weights in men: part II-the brain, lungs, liver, spleen, and kidneys. Am J Forensic Med Pathol 2012;33:368-72. [Crossref] [PubMed]
- Stocks J, Quanjer PH. Reference values for residual volume, functional residual capacity and total lung capacity. Eur Respir J 1995;8:492-506. [Crossref] [PubMed]
- Garnett ES, Webber CE, Coates G, et al. Lung density: clinical method for quantitation of pulmonary congestion and edema. Can Med Assoc J 1977;116:153-4. [PubMed]
- Sahn SA. Getting the most from pleural fluid analysis. Respirology 2012;17:270-7. [Crossref] [PubMed]
- Light RW. Falsely high refractometric readings for the specific gravity of pleural fluid. Chest 1979;76:300-1. [Crossref] [PubMed]
- Tavana S, Tavakoli H, Hashemzadeh M, et al. Specific gravity of pleural fluid determined by refractometer to discriminate exudates and transudates. Research Journal of Medical Sciences 2009;3:91-4.
- Surprenant EL, Rodbard S. A hydrostatic pressure gradient in the pleural sac. Am Heart J 1963;66:215-20. [Crossref] [PubMed]
- Banchero N, Schwartz PE, Tsakiris AG, et al. Pleural and esophageal pressures in the upright body position. J Appl Physiol 1967;23:228-34. [PubMed]
- Coulam CM, Wood EH. Regional differences in pleural and esophageal pressures in head-up and head-down positions. J Appl Physiol 1971;31:277-87. [PubMed]
- Lai-Fook SJ, Brown LV, Maudgalya VS, et al. Effect of increased acceleration on regional pleural pressure in dogs. J Appl Physiol 1991;71:611-9. [PubMed]
- Wiener-Kronish JP, Gropper MA, Lai-Fook SJ. Pleural liquid pressure in dogs measured using a rib capsule. J Appl Physiol 1985;59:597-602. [PubMed]
- Glazier JB, Hughes JM, Maloney JE, et al. Vertical gradient of alveolar size in lungs of dogs frozen intact. J Appl Physiol 1967;23:694-705. [PubMed]
- Thurlbeck WM, Marshall RM. Topography of esophageal pressure in the dog. J Appl Physiol 1973;34:590-6. [PubMed]
- Agostoni E. Mechanics of the pleural space. Physiol Rev 1972;52:57-128. [PubMed]
- Agostoni E. Mechanics of the pleural space. In: Handbook of Physiology. The Respiratory System. Mechanics of Breathing. Bethesda: Am Physiol Soc;1986:531-60.
- Hoppin FG Jr, Green ID, Mead J. Distribution of pleural surface pressure in dogs. J Appl Physiol 1969;27:863-73. [PubMed]
- Krueger JJ, Bain T, Patterson JL. Elevation gradient of intrathoracic pressure. J Appl Physiol 1961;16:465-8. [PubMed]
- McMahon SM, Proctor DF, Permutt S. Pleural surface pressure in dogs. J Appl Physiol 1969;27:881-5. [PubMed]
- Proctor DF, Caldini P, Permutt S. The pressure surrounding the lungs. Respir Physiol 1968;5:130-44. [Crossref] [PubMed]
- Arps JJ, Arps JL. The subsurface telemetry problem – a practical solution. Journal of Petroleum Technology 1964;16:487-93. [Crossref]
- Niven WD (editor). The scientific papers of James Clerk Maxwell. 2 vols. reprint Cammbridge: Cambridge University Press, 1890. New York: Dover Publications; 1952.
- Ziegler C, Torchia M, Grahame GR, et al. Peritoneal Surface-Active Material in Continuous Ambulatory Peritoneal Dialysis (CAPD) Patients. Perit Dial Int 1989;9:47-9. [PubMed]
- Grahame GR, Torchia MG, Dankewich KA, et al. Surface-active material in peritoneal effluent of CAPD patients. Perit Dial Int 1985;5:109-11.
- Hills BA, Burke JR, Thomas K. Surfactant barrier lining peritoneal mesothelium: lubricant and release agent. Perit Dial Int 1998;18:157-65. [PubMed]
- Schürch S, Goerke J, Clements JA. Direct determination of surface tension in the lung. Proc Natl Acad Sci USA 1976;73:4698-702. [Crossref] [PubMed]
- Eales NB. The anatomy of a foetal African elephant, Elephas africanus (Loxodonta africana). Transact R Soc Edinb 1929;56:203-46. [Crossref]
- West JB. Why Doesn’t the Elephant Have a Pleural Space? News Physiol Sci 2002;17:47-50. [PubMed]
- Meveychuck A, Osadchy A, Chen B, et al. Pleural effusion in chronic obstructive pulmonary medicine (COPD) patients in a medical intensive care unit: characteristics and clinical implications. Harefuah 2012;151:198-201. [PubMed]
- Agostoni E, Miserocchi G. Vertical gradient of transpulmonary pressure with active and artificial lung expansion. J Appl Physiol 1970;29:705-12. [PubMed]
- Lai-Fook SJ. Lung tissue mechanics. In: Epstein MAF (editor). Respiratory Biomechanics. New York: Springer;1990:39-43.
- Cambau T, Bico J, Reyssat E. Capillary rise between flexible walls. EPL 2011;96:24001. [Crossref]
- Denny E, Schroter RC. A model of non-uniform lung parenchyma distortion. J Biomech 2006;39:652-63. [Crossref] [PubMed]
- Hopkins SR, Prisk GK. Gravity is/is not the major factor determining the distribution of blood flow in the human lung. J Appl Physiol (1985) 2008;104:1537-8. [Crossref] [PubMed]
- Miserocchi G. Mechanisms controlling the volume of pleural fluid and extravascular lung water. Eur Respir Rev 2009;18:244-52. [Crossref] [PubMed]
- Zocchi L. Physiology and pathophysiology of pleural fluid turnover. Eur Respir J 2002;20:1545-58. [Crossref] [PubMed]
- Mordant P, Arame A, Legras A, et al. Pleural lymphatics and effusions. Rev Pneumol Clin 2013;69:175-80. [Crossref] [PubMed]
- Broaddus VC, Light RW. Disorders of the pleura: general principles and diagnostic approach. In: Murray JF, Nadel JA, editors. Textbook of respiratory medicine. Philadelphia: WB Saunders; 1994:2145-63.
- Schowalter TT. Mechanics of Secondary Hydrocarbon Migration and Entrapment. AAPG Bulletin 1979;63:723-60.
- Little WC, Freeman GL. Pericardial Disease. Circulation 2006;113:1622-32. [Crossref] [PubMed]
- Tebbe U, Scholz KH, Kreuzer H, et al. Changes in left ventricular diastolic function during exercise in patients with coronary artery disease. Eur Heart J 1987;8:21-8. [Crossref] [PubMed]
- Janicki JS. Influence of the pericardium and ventricular interdependence on left ventricular diastolic and systolic function in patients with heart failure. Circulation 1990;81:III15-20. [PubMed]
- Pompili C, Miserocchi G. Air leak after lung resection: pathophysiology and patients’ implications. J Thorac Dis 2016;8:S46-54. [PubMed]
- Chen CH, Liu TP, Chang H, et al. A chest drainage system with a real-time pressure monitoring device. J Thorac Dis 2015;7:1119-24. [PubMed]
- Varela G, Brunelli A, Jimenez MF, et al. Chest drainage suction decreases differential pleural pressure after upper lobectomy and has no effect after lower lobectomy Eur J Cardiothorac Surg 2010;37:531-4. [Crossref] [PubMed]
- Refai M, Brunelli A, Varela G, et al. The values of intrapleural pressure before the removal of chest tube in non-complicated pulmonary lobectomies Eur J Cardiothorac Surg 2012;41:831-3. [Crossref] [PubMed]

