

Computational fluid dynamic study of different incision length of coronary artery bypass grafting in a native coronary stenosis model
Introduction
In the setting of coronary artery bypass grafting (CABG), anastomosis length is usually determined by the surgeon’s preference and experience. For the patients undergoing CABG, it is crucial to maintain optimal flow to the target native artery to avoid competition or insufficient graft flow (1). To achieve long-term patency, it is also very important to avoid intimal hyperplasia or progression of atherosclerosis which is believed to be induced by the high wall shear stress (WSS) or turbulent flow. Lumped parameter model and 0–1D multiscale model are proved to be very effective in the simulation for global hemodynamics. However, to get comprehensive local hemodynamic information, a 3D computational fluid dynamic (CFD) model is required. The CFD method has been proved very effective to investigate the improvement for the cardiac surgeries (2-4). The investigation of the coronary bypass surgery has been carried on the patient-specific models, anastomosis angle, and anastomosis length (5-7). However, a comprehensive study on the variation on both anastomosis angel and anastomosis length has not been done yet.
In this study, the investigation of optimal combination for anastomosis angle and anastomosis length has been carried out. The flow pattern, WSS, oscillatory shear index (OSI), and energy loss has been compared between the different geometry models. The aim of this study is to determine the model with the combination of optimal flow pattern, low WSS, low OSI, and low energy loss.
Methods
The method of this study can be categorized into two parts: modeling for the geometry and the CFD simulation. In this study, modeling for the geometry was carried out on the Solid Works 13.0 (Dassault Systems SOLID WORKS Corp, Waltham, MA, USA), whereas the CFD simulation was achieved by the ANSYS CFX 16.0 (ANSYS, Inc. Canonsburg, PA, USA).
Geometry (Solid Works 13.0)
Different anastomosis length for the end-side anastomosis was taken into account. The angle between the two blood vessels in the end-side anastomosis model corresponded to the length of the incision, that is, the only the incision length was fixed and the angle was corresponded to the incision length. The anastomosis length variants from 2 to 10 mm with an interval of 2 mm. Because the velocity profile became stable at the site between 30 to 40 mm from the inlet in the simple tube model, the distances from the inlets to the anastomosis and the anastomosis to the outlets were set to be 40 mm in all cases. Whereas, the distance from the anastomosis to the native stenosis site was set to be 10 mm in all cases to make it close to the actual surgical condition. Native vessels were set to be 90% stenosis. The radius of each of the two blood vessels was set to be 2 mm. Moreover, the surface fillet was used to smoothen the edge at the anastomosis sites and stenosis sites. The fillet radius was set to be 0.2 mm for all cases.
Computation (ANSYS CFX)
The geometries were imported into the geometry module in the ANSYS, meshes were generated with the meshing module in the ANSYS, and the CFD simulations were carried out by using ANSYS CFX. Volume meshes were generated for all cases. The sensitivity of the meshes was tested out with a simple tube model, and minimal size of 0.009 mm was adopted in this study. The number of the nodes was variant from 23,034 to 52,802, and the number of the elements was variant from 104,479 to 263,041. Boundary layer was generated with a maximum number of 5. The physiological condition of the blood was considered an incompressible Newtonian fluid, and laminar model for fluid dynamic computation was adopted. The density and viscosity of the blood were 1,060 kg/m3, and 0.0035 Pa/s, respectively. The initial flow and pressure were set to be 0 in each case. The inlet boundary conditions in each case were the blood velocity taken from the transient time flow measurement (TTFM) during the surgery by the Veri Q system (Medi-stim, Inc. MN, USA). We used the typical inlet flow sample of the internal thoracic artery (ITA) to left anterior descending (LAD) artery bypass case. The velocity waveform was shown in Figure 1. Furthermore, the blood velocities at the inlet of the native coronary arteries with stenosis were adjusted to match the severity of the stenosis. The outlet boundary conditions in each case was the fixed relative blood pressure, which was equal to the barometric pressure. Moreover, the sensitivity of the time steps was also tested out with a simple tube model. In this study, the time step was set to be 0.001 s and the data output frequency was 100 Hz in each cardiac cycle (1.0 s). Flow at the native outlet and the bypass outlet, and total energy efficiency were calculated. Streamlines, velocity vector, vortex, WSS, and OSI were also calculated.

Energy loss (8):
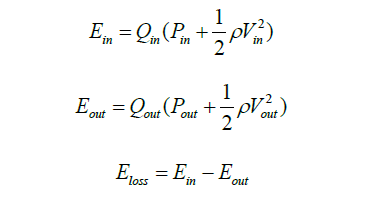
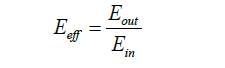
Energy efficiency:
Results
Flow end energy efficiency
Energy loss and energy efficiency have been calculated in all cases. The results of energy loss and energy efficiency are shown in Figures 1,2, respectively. The lowest energy loss and the highest energy efficiency are presented in the anastomosis length of 8 mm. Therefore, in the end-side anastomosis, an anastomosis length of 8 mm was the ideal length.

Streamline, velocity vector, vortex
The streamlines in the end-side anastomosis for a 90% stenosis of the anastomosis length of 2, 4, 6, 8, 10 mm were presented in Figures 3-7, respectively. The swirling at the outlet of the stenosis site and the anastomosis were shown in all cases. Moreover, stagnation at the bottom of the outlet of the stenosis was presented in the anastomosis length of 10 mm. High velocity can be observed at the bottom of the anastomosis site, and it decreases as the length of anastomosis increases. Furthermore, the case of anastomosis length of 8 mm shows the weakest stagnation among all anastomosis length.


The OSI, which is timely change of WSS, was calculated in all models. High OSI is thought to be related to the future intimal hyperplasia. High OSI can be observed at the stenosis and the anastomosis sites. As the velocity of the blood flow increases, the OSI in the bypass graft and the native coronary outlet increase correspondingly. The high OSI region decrease, as the anastomosis length increase until 8 mm of incision length. However, when the anastomosis length is greater than 8 mm, the OSI region did not decrease significantly (Figure 8).

Discussion
As a result of the SYNTAX trial, Serruys et al. reported that CABG remains the standard therapeutic option for patients with a triple vessel or left main disease since the use of CABG resulted in lower rates of the combined end of major adverse cardiac and cerebrovascular events at 1 year compared to percutaneous coronary intervention (PCI) (14). Thereby the most CABG patients have more complex and multiple lesions and needs multiple bypass grafting. That is why it is crucial to employ various graft designs. Because sometimes we need to revascularize the moderate stenotic lesions, graft design strategies are important especially in preventing the incidence of reverse or competitive flow (1). In the field of PCI, fractional flow reserve (FFR)-guided PCI is becoming the standard of care to determine the need for revascularization (15). Similarly, in the setting of CABG, we should consider the graft design to avoid the competitive flow when we need to revascularize low FFR lesions.
Richter described that flow explains the form and function of the heart and the blood vessels (16). As Richter described, the CFD model has been an important solution in achieving optimal blood flow of various configurations of CABG (16-19). The CFD model gives us useful information from the clinical point of view. When you focus on flow, optimal flow to the native outlet is important to gain early patency in the first place. In the setting of native stenosis model, flow competition is a matter of concern.
Tsukui et al. reported about the quality of the long distal anastomosis using the training simulator model (7). They reported that the 10-mm distal anastomosis provided a higher quality of distal anastomosis which yielded lower energy loss at distal anastomosis than 4-mm distal anastomosis. According to their study, we hypothesized that the longer the end-side anastomosis was, the higher the energy efficiency. However, our current study revealed that an anastomosis length of 8 mm was the ideal length with less flow complexity, low WSS and OSI, and less energy loss and high energy efficiency. In the model of 10-mm incision length, stagnation at the bottom of the outlet of the stenosis was presented, which would cause the reduction of energy efficiency in 10-mm incision model. We believed that the longer the incision is, the better the energy efficiency is. But our current study showed that the very long anastomoses would not provide any benefits.
The energy efficiency reflects flow dynamic energy loss such as the vortex and turbulent flow. The streamline was also smoother when the anastomotic angle was gentler, seen in the longer anastomosis. The difference in the vector between the top and the bottom was smaller when the anastomotic angle was gentler, seen in longer anastomosis. So, in that sense, the longer the anastomosis was, the higher the energy efficiency was in the end-side anastomosis, but the total energy efficiency was highest in the 8mm incision model. This was because of the stagnation at outlet bottom in 10-mm incision model. Further individual optimized CFD models will give us more information in detail.
Long-term patency is also very important in CABG. Gibson et al. reported in 1993 that distribution of WSS may explain the atherosclerotic progression in multiple lesions (20). Since then, there have been many reports about the relationships between shear stress and atherosclerotic changes or hyperplasic progression or plaque disruption (5,6,20-29). Ramaswamy et al. reported that the time-mean WSS and the OSI may provide more realistic predictions on the progression of atherosclerotic disease (5). Samady et al. concluded that low-WSS segments developed greater plaque and necrotic core progression and constrictive remodeling, while high-WSS segments developed greater necrotic core and calcium progression, regression of fibrous and fibrofatty tissue, and excessive expansive remodeling, suggestive of transformation to a more vulnerable phenotype (22). In general, the extremely high or low shear stress which is high OSI, and the spatial and temporal variation of the shear stress would cause the atherosclerotic change.
In this current study, we took notice of the distribution of OSI. This result showed that OSI was high at the outlet top in most models. Therefore, we should be meticulous with anastomosis at the outlet top. We need to be careful about future atherosclerotic change, neointimal hyperplasia and plaque rupture at this point. It might be a reasonable option to choose a specific anastomosis to avoid high OSI at severely diseased target vessels. And the high OSI region decreases as the anastomosis length increased until 8 mm of incision length. However, when the anastomosis length is greater than 8 mm, the OSI region did not decrease significantly. An anastomosis length of 8 mm was the ideal length with less flow complexity, low OSI.
There are other factors that affect flow or shear stress. Vimmr et al. reported that in the case of sequential grafts, the resulting flow field and shear stimulation are strongly influenced by the diameter of the vessels involved in the bypass (27). In this study, we fixed the diameter of the graft and native coronary vessels. These factors should be considered for future CABG CFD models.
Limitations
There were several limitations to this study. Although this study was ideal CFD model which was reconstructed only the computer, the individually reconstructed CFD model which is reconstructed by the radiographic data taken from the real CABF patients is necessary for validation. We used the inlet flow of the real typical ITA-LAD model. More variation in inlet flow patterns should be taken into consideration to demonstrate the various models. Although we focused on the individual end-side bypass grafting, we evaluated only one anastomosis in each model. And to simplify the study, we studied 90% stenosis only. We need to consider about moderate stenosis model in future studies.
Although this present study was very simple model, to simulate the humans blood vessels, we need to consider the vasoreactivity, microvasculature, flow demand, biological parameters metabolism, and so on. Future studies should consider these factors as well. Furthermore, it will be necessary to compare these optimal model study and animal study in the future.
Conclusions
In the end-side anastomosis, an anastomosis length of 8 mm was the ideal length with less flow complexity, low WSS and OSI, and less energy loss and high energy efficiency.
Acknowledgements
None.
Footnote
Conflicts of Interest: The authors have no conflicts of interest to declare.
References
- Nakajima H, Kobayashi J, Tagusari O, et al. Graft design strategies with optimum antegrade bypass flow in total arterial off-pump coronary artery bypass. Eur J Cardiothorac Surg 2007;31:276-82. [Crossref] [PubMed]
- Pekkan K, Whited B, Kanter K, et al. Patient-specific surgical planning and hemodynamic computational fluid dynamics optimization through free-form haptic anatomy editing tool (SURGEM). Med Biol Eng Comput 2008;46:1139-52. [Crossref] [PubMed]
- Itatani K, Miyaji K, Tomoyasu T, et al. Optimal conduit size of the extracardiac Fontan operation based on energy loss and flow stagnation. Ann Thorac Surg 2009;88:565-72; discussion 572-3. [Crossref] [PubMed]
- Lee KE, Kim GT, Lee JS, et al. A patient-specific virtual stenotic model of the coronary artery to analyze the relationship between fractional flow reserve and wall shear stress. Int J Cardiol 2016;222:799-805. [Crossref] [PubMed]
- Ramaswamy SD, Vigmostad SC, Wahle A, et al. Fluid dynamic analysis in a human left anterior descending coronary artery with arterial motion. Ann Biomed Eng 2004;32:1628-41. [Crossref] [PubMed]
- Sankaran S, Esmaily Moghadam M, Kahn AM, et al. Patient-specific multiscale modeling of blood flow for coronary artery bypass graft surgery. Ann Biomed Eng 2012;40:2228-42. [Crossref] [PubMed]
- Tsukui H, Shinke M, Park YK, et al. Longer coronary anastomosis provides lower energy loss in coronary artery bypass grafting. Heart Vessels 2017;32:83-9. [Crossref] [PubMed]
- Marsden AL, Vignon-Clementel IE, Chan FP, et al. Effects of exercise and respiration on hemodynamic efficiency in CFD simulations of the total cavopulmonary connection. Ann Biomed Eng 2007;35:250-63. [Crossref] [PubMed]
- Matsuura K, Jin WW, Liu H, et al. Stream line of 2-mm incision model was shown. Asvide 2019;6:046. Available online: http://www.asvide.com/article/view/30101
- Matsuura K, Jin WW, Liu H, et al. Stream line of 4-mm incision model was shown. Asvide 2019;6:047. Available online: http://www.asvide.com/article/view/30102
- Matsuura K, Jin WW, Liu H, et al. Stream line of 6-mm incision model was shown. Asvide 2019;6:048. Available online: http://www.asvide.com/article/view/30103
- Matsuura K, Jin WW, Liu H, et al. Stream line of 8-mm incision model was shown. Asvide 2019;6:049. Available online: http://www.asvide.com/article/view/30104
- Matsuura K, Jin WW, Liu H, et al. Stream line of 10-mm incision model was shown. Asvide 2019;6:050. Available online: http://www.asvide.com/article/view/30106
- Serruys PW, Morice MC, Kappetein AP, et al. Percutaneous coronary intervention versus coronary artery bypass grafting for severe coronary artery disease. N Engl J Med 2009;360:961-72. [Crossref] [PubMed]
- Fearon WF, Bornschein B, Tonino PA, et al. Economic evaluation of fractional flow reserve-guided percutaneous coronary intervention in patients with multivessel disease. Circulation 2010;122:2545-50. [Crossref] [PubMed]
- Richter Y, Edelman ER. Cardiology is flow. Circulation 2006;113:2679-82. [Crossref] [PubMed]
- Sankaranarayanan M, Chua LP, Ghista DN, et al. Flow studies in three-dimensional aorto-right coronary bypass graft system. J Med Eng Technol 2006;30:269-82. [Crossref] [PubMed]
- Ghista DN, Kabinejadian F. Coronary artery bypass grafting hemodynamics and anastomosis design: a biomedical engineering review. Biomed Eng Online 2013;12:129. [Crossref] [PubMed]
- Owida AA, Do H, Morsi YS. Numerical analysis of coronary artery bypass grafts: an over view. Comput Methods Programs Biomed 2012;108:689-705. [Crossref] [PubMed]
- Gibson CM, Diaz L, Kandarpa K, et al. Relation of vessel wall shear stress to atherosclerosis progression in human coronary arteries. Arterioscler Thromb 1993;13:310-5. [Crossref] [PubMed]
- Hajati O, Zarrabi K, Karimi R, et al. CFD simulation of hemodynamics in sequential and individual coronary bypass grafts based on multislice CT scan datasets. Conf Proc IEEE Eng Med Biol Soc 2012;2012:641-4. [PubMed]
- Samady H, Eshtehardi P, McDaniel MC, et al. Coronary artery wall shear stress is associated with progression and transformation of atherosclerotic plaque and arterial remodeling in patients with coronary artery disease. Circulation 2011;124:779-88. [Crossref] [PubMed]
- Sankaranarayanan M, Chua LP, Ghista DN, et al. Computational model of blood flow in the aorto-coronary bypass graft. Biomed Eng Online 2005;4:14. [Crossref] [PubMed]
- Qiao A, Liu Y. Influence of graft-host diameter ratio on the hemodynamics of CABG. Biomed Mater Eng 2006;16:189-201. [PubMed]
- Katritsis D, Kaiktsis L, Chaniotis A, et al. Wall shear stress: theoretical considerations and methods of measurement. Prog Cardiovasc Dis 2007;49:307-29. [Crossref] [PubMed]
- Corban MT, Eshtehardi P, Suo J, et al. Combination of plaque burden, wall shear stress, and plaque phenotype has incremental value for prediction of coronary atherosclerotic plaque progression and vulnerability. Atherosclerosis 2014;232:271-6. [Crossref] [PubMed]
- Vimmr J, Jonášová A, Bublík O. Numerical analysis of non-Newtonian blood flow and wall shear stress in realistic single, double and triple aorto-coronary bypasses. Int J Numer Method Biomed Eng 2013;29:1057-81. [Crossref] [PubMed]
- Cheng C, Tempel D, van Haperen R, et al. Atherosclerotic lesion size and vulnerability are determined by patterns of fluid shear stress. Circulation 2006;113:2744-53. [Crossref] [PubMed]
- Eshtehardi P, McDaniel MC, Suo J, et al. Association of coronary wall shear stress with atherosclerotic plaque burden, composition, and distribution in patients with coronary artery disease. J Am Heart Assoc 2012;1:e002543. [Crossref] [PubMed]

