

Development and validation of a predictive model for the diagnosis of solid solitary pulmonary nodules using data mining methods
Introduction
Lung cancer is the most common cancer and the leading cause of cancer death in China. It is estimated to be responsible for more than 0.61 million deaths in 2015 (1). With the advent of widely available computed tomography (CT) scanning, the number of discovered pulmonary nodules has significantly increased. The National Lung Cancer Screening Test (NLST) revealed a relative 20% reduction in mortality from lung cancer with low-dose CT screening when compared with chest radiography (2). However, more than 90% of the nodules detected in CT screening were benign lesions. It is thus crucial for surgeons and physicians to accurately evaluate the lesion, as mischaracterization can either lead to unjustified surgery of benign lesions or delayed treatment of malignancy nodules (3).
A solitary pulmonary nodule (SPN) is defined as an approximately round lesion that is less than 3 cm in diameter and is completely surrounded by pulmonary parenchyma, without any associated atelectasis, lymphadenopathy or pleural effusion (4-6). SPNs can be classified into solid or subsolid types according to CT manifestation. Data from lung cancer screening tests have revealed that subsolid nodules have a significantly greater likelihood of being malignant than solid nodules on first screening CT (7,8). Of the patients who received surgical resections, the malignant ratio for subsolid nodules can be above 90% (9,10), while the malignant ratio for solid nodules ranges from 53% to 75% (11-14). This highlights the necessity of differentiating the nature of solid SPNs in an accurate and timely manner.
Although surgeons routinely make such judgments in the day to day practice, a standardized management approach has been established to estimate the malignancy of SPNs (3,7,11-13,15,16). The most extensively used model was established by Swensen et al. in the 1990s (15). However, 12% of the patients did not have a final diagnosis in their study. Another widely used approach is the Brock model established by McWilliams et al. (7), although both solid and subsolid SPNs were mixed together in that model. In addition, most of the previously proposed models were based on logistic regression (LR) analysis. Data mining, also known as knowledge-discovery in databases (KDD), is a new interdisciplinary branch of science which combines automated methods and statistical knowledge (17,18). The process tries to discover potential relationships and establish appropriate models of data and is considered as an effective method of discovering useful information from data. In our previous study (10), we tested the ability of certain data mining methods to differentiate between benign and malignant pulmonary ground-glass nodules (GGNs) and to predict invasiveness of malignant nodules. We found a good diagnostic value in predicting the malignancy and invasiveness of pulmonary GGNs by random forest (RF). The purpose of this study is to identify the clinical and radiological features that may help decide the malignancy of solid SPNs and to develop an effective and efficient model by data mining methods.
Methods
Data collection
Retrospective data of 588 consecutive patients with solid SPNs who received surgical resection from 2013 to 2016 at Shanghai Chest Hospital were analyzed. All of the patients had a definite pathological diagnosis. CT scans were conducted using a 64-detector CT row scanner (Brilliance 64; Philips, Eindhoven, The Netherlands). The images were reconstructed using soft tissue and lung algorithms with a thickness of 1 mm. The CT features were evaluated in the following settings: lung window center, −520 HU/lung window width, 1,450 HU; mediastinal window center, 40 HU/mediastinal window width, 350 HU. The description of CT imagines and data collection were conducted by three thoracic radiologists (X Ye, L Zhu and Q Chen) and two thoracic surgeons (Y Sun and Y Xiang).
The clinical data included patients’ gender, age, smoking history, smoking quantity, previous malignancy and position of the lesion. The radiologic characters included the nodule diameter, the presence of spiculation, calcification, pleural indentation, lobulation and vascular convergence. Specific patterns of calcification manifesting as diffuse solid, laminated, concentric or popcorn were excluded from this study as they often suggest a benign lesion (6). The tumor biomarkers include carbohydrate antigen 125 (CA125), carcinoembryonic antigen (CEA), cytokeratin-19-fragment, (CYFRA21-1), neuron-specific enolase (NSE), and squamous cell carcinoma antigen (SCC).
Statistical analysis and model construction
Patients who received surgery from January 2013 to December 2015 were assigned to the training cohort (n=388). Those who received surgery from January 2016 to December 2016 were assigned to the validation cohort (n=200). The clinical, radiological and tumor biomarkers were analyzed by SPSS Statistics 19.0 software to compare the baseline demographic features of the train cohort against the validation cohort. Quantitative variables were evaluated by the Student’s t-test, while qualitative variables were examined with the Chi-square test.
By using the SPSS Modeler 18.0, five classifiers including LR, artificial neural network (ANN), k-nearest neighbor (KNN), RF, and support vector machines (SVM) were used to establish the model. A brief description of these data mining methods and the Mayo model is shown in Table 1.

Full table
The parameters of classifiers play an important role in the classification performance and we set the parameters as follows to enhance the performance of each classifier: the radial basis function kernel as the kernel of the SVM, with the parameter C=16, γ=0.06 (1/number of features); Euclidean distance function as the distance metric in KNN, with the number of nearest neighbor ranging from 3 to 5; a multilayer perceptron neural network for the ANN model consisting of one input layer, one or more hidden layers and an output layer; one hundred decision tree number in RF model with the max feature including all the features input; binomial LR in the LR model with forward selection.
Model validation
To prospectively evaluate the diagnostic efficiency, the data of the validation cohort was input into the five models by SPSS Modeler. Predictive performance was evaluated using the area under the receiver operating characteristic (ROC) curve. The Mayo model (15) was also evaluated by the validation cohort. Sensitivity, specificity, accuracy, positive predictive value (PPV) and negative predictive value (NPV) of each model were evaluated.
Matthews correlation coefficient (MCC) is typically used in machine learning as a measure of the quality of binary (two class) classifications introduced by the biochemist Brian W. Matthews in 1975 (23). The MCC is in essence a correlation coefficient between the observed and predicted binary classifications; it returns a value between −1 and +1. A coefficient of +1 represents a perfect prediction, 0 represents no better than a random prediction and −1 represents a total disagreement between prediction and observation. The formula can be expressed as the following:
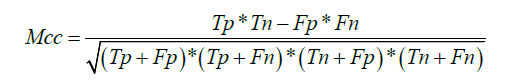
Tp is the number of true positives; Tn is the number of true negatives; Fp is the number of false positives; Fn is the number of false negatives.
Results
Patients characteristics
The characteristics of 588 participants with solid SPNs are described in Table 2. The patient group was comprised of 339 (57.7%) males and 249 (42.3%) females with an average age of 59.98±10.21 years. Overall, 462 (78.6%) patients were pathologically proven to have a malignant lesion and 126 (21.4%) patients had a benign lesion. The 462 malignant tumors consisted of 381 (82.5%) cases of adenocarcinoma, 35 (7.6%) cases of squamous cell carcinoma, 5 (1%) cases of adenosquamous carcinoma, 6 (1.3%) cases of small cell carcinoma, 9 (1.9%) cases of large cell carcinoma, 3 (0.6%) cases of carcinoid, 20 (4.3%) cases of metastatic tumor, 1 (0.2%) case of sarcomatoid carcinoma and 2 (0.4%) cases of lymphoepithelioma. There was no significant difference between the training cohort and the validation cohort in terms of patient or tumor characteristics.

Full table
Predictive performance of the five models
Predictive performance of the five models for the validation cohort is shown by the ROC curves in Figure 1. SVM model achieved the highest AUC of 0.890±0.0323. The AUC of LR, ANN, KNN, RF and the Mayo model was 0.874±0.0280, 0.833±0.0351, 0.792±0.0418, 0.775±0.0400, and 0.793±0.0416, respectively (Figure 1). The SVM model had a better predictive performance than the Mayo model (P=0.030) (Table 3). SVM showed equivalent sensitivity to LR, but had the best specificity, PPV, NPV, accuracy and MCC for the validation cohort. A detailed comparison of the performance of each model in predicting the malignancy of solid SPNs is summarized in Table 4.


Full table

Full table
Identified variables
The ten most important variables in the SVM model included lobulation, calcification, spiculation, pleural indentation, diameter, age, vascular convergence, CEA, previous malignancy and smoking history. The relative importance of these variables can be seen in Figure 2.

Discussion
Evaluating the probability of malignancy is an important step in the management decision making for SPNs, since timely treatment is associated with more favorable prognosis and over diagnosis may cause unnecessary biopsies, radiation exposure, and other secondary costs of screening. Differential diagnosis of solid SPNs has proven to be more difficult than subsolid nodules and thus, has become a pressing problem in daily practice. A comprehensive evaluation of clinical and radiological characteristics is needed to establish the probability of malignancy before treatment (16,24). With a sole focus on the solid nodules, our study made an initial effort in exploring the potential of diagnosing SPNs by using data mining methods.
Five classifiers were utilized in our study among which SVM achieved the best predictive performance with the top AUC of 0.890 for the validation cohort. LR is a traditional and prevalent algorithm which has been widely used in industrial scale problems and health research (25). Previous studies of evaluating the malignancy of pulmonary nodules were mainly based on the LR algorithm (11-13,15). The heuristic behind SVM is quite different from LR. The LR algorithm uses a weighted least squares algorithm (26). SVM is based on the structural risk minimization criterion and the Vapnik-Chervonenkis concept (22), which directly finds the best dividing hyperplane regardless of the actual probability of class membership. In the classification problems, SVM generally showed equal or superior performance than LR (27). Examples of applications using SVM include image recognition (28), medical diagnostics (10), survival prediction (29), and analysis of bioinformatics and genetics (30). In our study, SVM showed equivalent sensitivity to LR, but outperformed LR in specificity, PPV, NPV and accuracy for the validation cohort.
In the present study, three clinical variables (age, previous malignancy and smoking history), six radiological characteristics (diameter, lobulation, calcification, spiculation, pleural indentation, vascular convergence) and one serum tumor marker (CEA) were adopted as important predictors in the SVM model. Comparing with other models based on the LR algorithm, the SVM model contained more predictors of malignancy for patients with solid SPNs. Pleural indentation, vascular convergence and CEA have seldom been reported as independent predictors in the LR algorithm. However, it has been widely recognized that the presence of pleural indentation sign and vascular convergence sign were associated with malignant SPNs (31). CEA has been demonstrated as an effective marker for a wide range of malignancies (32). As reported by Yonemori et al. (14), the mean serum CEA was significantly higher in malignant SPNs compared to benign SPNs. By combing more variables, it is not surprising that the SVM algorithm achieved better predictive performance than the LR algorithm. In other words, more hidden risk factors associated with the diagnosis of SPNs were discovered by data mining methods. We suggest that data mining methods can be applied in more medical fields to explore risk factors, discover hidden relationships, establish appropriate models and improve management outcomes.
The clinical and radiological data we collected were easily available in daily work. The five serum tumor makers are routinely examined before operation. SPSS Statistics 19.0 and SPSS Modeler 18.0 were the software programs we used to construct the five models. SPSS Statistics is widely used in medical record and statistical analysis. SPSS Modeler allows data mining to be a highly accessible approach for clinicians. As expected, data mining methods such as SVM showed greater accuracy with the combination of more variables than the conventional LR algorithm. However, this is just an initial attempt which awaits for further validation in a wider range of study. When the data series become more complicated, such as if the radiomics features are used to describe the SPNs, the advantages of data mining methods over traditional algorithms may be more comprehensively verified. In terms of making the diagnosis of SPNs more efficient and accurate, it is still worth exploring more complicated machine learning techniques even though the predictive performance of SVM is only slightly better than the LR algorithm in our current study. The problem is that data mining methods are usually connected with complicated statistical methods and the formulas are expressed as a very abstruse pattern. How to implement these models in the clinical practice is an important question we need to solve in the future.
There were several limitations in our study. First, the radiologic features of SPNs that we collected in our study were described by radiologists and surgeons instead of being captured directly as information from the CT images. Future research will use the imaging dataset directly to develop deep learning algorithms for similar purposes. Second, positron emission tomography (PET) scan was not adopted as a differential feature in our study. PET scan is helpful in the differential diagnosis of lung cancer. However, it has not been a routine examination due to its high expense and its inability to provide useful information in SPNs smaller than 8 mm (33). Third, there was a relatively small cohort of patients included in our study which may limit the generalizability of our results. We speculate that the strengths of applying data mining algorithms to the diagnosis of solid SPNs may be more fully verified in a larger population since data mining, when compared to traditional statistical methods, has advantages in handling large scale and high dimensional data sets.
In conclusion, our study compared five data mining algorithms to predict the malignancy of solid SPNs, and SVM achieved the best predictive performance. We expect that data mining methods such as SVM could serve as an effective alternative to conventional LR in identifying the key variables and evaluating the malignancy of solid SPNs in a more accurate and timely manner.
Acknowledgements
Funding: This work is supported by the Shanghai Science and Technology Commission Foundation Project (No. 14411950800) (W Gao).
Footnote
Conflicts of Interest: The authors have no conflicts of interest to declare.
Ethical Statement: The study was approved by the Institutional Review Board of the hospital (Number/ID of the Ethics Approval is ks14029). Informed consent was waived because of the retrospective nature of the study.
References
- Chen W, Zheng R, Baade PD, et al. Cancer statistics in China, 2015. Ca Cancer J Clin 2016;66:115-32. [Crossref] [PubMed]
- Aberle DR, Adams AM, Berg CD, et al. Reduced lung-cancer mortality with low-dose computed tomographic screening. N Engl J Med 2011;365:395-409. [Crossref] [PubMed]
- Soardi GA, Perandini S, Motton M, et al. Assessing probability of malignancy in solid solitary pulmonary nodules with a new Bayesian calculator: improving diagnostic accuracy by means of expanded and updated features. Eur Radiol 2015;25:155-62. [Crossref] [PubMed]
- Ost D, Fein AM, Feinsilver SH. Clinical practice. The solitary pulmonary nodule. N Engl J Med 2003;348:2535-42. [Crossref] [PubMed]
- Patel VK, Naik SK, Naidich DP, et al. A practical algorithmic approach to the diagnosis and management of solitary pulmonary nodules: part 1: radiologic characteristics and imaging modalities. Chest 2013;143:825-39. [Crossref] [PubMed]
- Tang AW, Moss HA, Robertson RJ. The solitary pulmonary nodule. Eur J Radiol 2003;45:69-77. [Crossref] [PubMed]
- McWilliams A, Tammemagi MC, Mayo JR, et al. Probability of cancer in pulmonary nodules detected on first screening CT. N Engl J Med 2013;369:910-9. [Crossref] [PubMed]
- Henschke CI, Yankelevitz DF, Mirtcheva R, et al. CT screening for lung cancer: frequency and significance of part-solid and nonsolid nodules. AJR Am J Roentgenol 2002;178:1053. [Crossref] [PubMed]
- Yang W, Sun Y, Fang W, et al. High-resolution Computed Tomography Features Distinguishing Benign and Malignant Lesions Manifesting as Persistent Solitary Subsolid Nodules. Clin Lung Cancer 2018;19:e75-83. [Crossref] [PubMed]
- Mei X, Wang R, Yang W, et al. Predicting malignancy of pulmonary ground-glass nodules and their invasiveness by random forest. J Thorac Dis 2018;10:458-63. [Crossref] [PubMed]
- Li Y, Chen KZ, Wang J. Development and Validation of a Clinical Prediction Model to Estimate the Probability of Malignancy in Solitary Pulmonary Nodules in Chinese People. Clinical Lung Cancer 2011;12:313-9. [Crossref] [PubMed]
- She Y, Zhao L, Dai C, et al. Development and validation of a nomogram to estimate the pretest probability of cancer in Chinese patients with solid solitary pulmonary nodules: A multi-institutional study. J Surg Oncol 2017;116:756. [Crossref] [PubMed]
- Gould MK, Ananth L, Barnett PG. A Clinical Model To Estimate the Pretest Probability of Lung Cancer in Patients With Solitary Pulmonary Nodules. Chest 2007;131:383-8. [Crossref] [PubMed]
- Yonemori K, Tateishi U, Uno H, et al. Development and validation of diagnostic prediction model for solitary pulmonary nodules. Respirology 2007;12:856-62. [Crossref] [PubMed]
- Swensen SJ, Silverstein MD, Ilstrup DM, et al. The probability of malignancy in solitary pulmonary nodules. Application to small radiologically indeterminate nodules. Arch Intern Med 1997;157:849. [Crossref] [PubMed]
- Baldwin DR, Callister ME. Guideline Development Group. The British Thoracic Society guidelines on the investigation and management of pulmonary nodules. Thorax 2015;70:794-8. [Crossref] [PubMed]
- Joudaki H, Rashidian A, Minaeibidgoli B, et al. Using Data Mining to Detect Health Care Fraud and Abuse: A Review of Literature. Glob J Health Sci 2014;7:194-202. [Crossref] [PubMed]
- Liou DM, Chang WP. Applying data mining for the analysis of breast cancer data. Methods Mol Biol 2015;1246:175-89. [Crossref] [PubMed]
- Noaman AY, Nadeem F, Ragab AHM, et al. Improving Prediction Accuracy of “Central Line-Associated Blood Stream Infections” Using Data Mining Models. Biomed Res Int 2017;2017:3292849. [Crossref] [PubMed]
- Jia W, Zhao D, Shen T, et al. Study on optimized Elman neural network classification algorithm based on PLS and CA. Comput Intell Neurosci 2014;2014:724317. [Crossref] [PubMed]
- Salari N, Shohaimi S, Najafi F, et al. A Novel Hybrid Classification Model of Genetic Algorithms, Modified k-Nearest Neighbor and Developed Backpropagation Neural Network. Plos One 2014;9:e112987. [Crossref] [PubMed]
- Ahmadi H, Rodehutscord M. Application of Artificial Neural Network and Support Vector Machines in Predicting Metabolizable Energy in Compound Feeds for Pigs. Front Nutr 2017;4:27. [Crossref] [PubMed]
- Matthews BW. Comparison of the predicted and observed secondary structure of T4 phage lysozyme. Biochim Biophys Acta 1975;405:442-51. [Crossref] [PubMed]
- Patel VK, Naik SK, Naidich DP, et al. A practical algorithmic approach to the diagnosis and management of solitary pulmonary nodules: part 2: pretest probability and algorithm. Chest 2013;143:840-6. [Crossref] [PubMed]
- Yusuf OB, Bamgboye EA, Afolabi RF, et al. An appraisal of convergence failures in the application of logistic regression model in published manuscripts. Afr J Med Med Sci 2014;43:195. [PubMed]
- Lee SK, Kang BY, Kim HG, et al. Predictors of Medication Adherence in Elderly Patients with Chronic Diseases Using Support Vector Machine Models. Healthc Inform Res 2013;19:33-41. [Crossref] [PubMed]
- Lin Y, Lee Y, Wahba G. Support Vector Machines for Classification in Nonstandard Situations. Machine Learning 2002;46:191-202. [Crossref]
- Jiang Hongyang, Ma He, Qian Wei, et al. A novel pixel value space statistics map of the pulmonary nodule for classification in computerized tomography images. Conf Proc IEEE Eng Med Biol Soc 2017;2017:556-9. [PubMed]
- Lotfnezhad Afshar H, Ahmadi M, Roudbari M, et al. Prediction of Breast Cancer Survival Through Knowledge Discovery in Databases. Glob J Health Sci 2015;7:392-8. [Crossref] [PubMed]
- Ogutu J O, Piepho H P, Schulzstreeck T. A comparison of random forests, boosting and support vector machines for genomic selection. BMC Proc 2011;5 Suppl 3:S11. [Crossref] [PubMed]
- Snoeckx A, Reyntiens P, Desbuquoit D, et al. Evaluation of the solitary pulmonary nodule: size matters, but do not ignore the power of morphology. Insights Imaging 2018;9:73-86. [Crossref] [PubMed]
- Sawabata N, Ohta M, Takeda S, et al. Serum carcinoembryonic antigen level in surgically resected clinical stage I patients with non-small cell lung cancer. Ann Thorac Surg 2002;74:174-9. [Crossref] [PubMed]
- Groheux D, Quere G, Blanc E, et al. FDG PET-CT for solitary pulmonary nodule and lung cancer: Literature review. Diagn Interv Imaging 2016;97:1003-17. [Crossref] [PubMed]

