

Different metrics (number, surface area, and volume concentration) of urban particles with varying sizes in relation to fractional exhaled nitric oxide (FeNO)
Introduction
Particles in the atmosphere have a wide range of sizes due to their formation mechanisms. There are typically four modes by number concentration in the size distribution of ambient particles (i.e., nucleation mode, Aitken mode, accumulation mode, and coarse mode) (1). Nucleation-mode particles, with diameters below 10 nm, are freshly formed through nucleation in the gas-to-particle conversion process. Aitken-mode particles, with diameters between 10 and 100 nm, are formed through nucleation or condensation. Accumulation-mode particles are formed through condensation or coagulation; these particles usually have aerodynamic diameters in the range of 0.1 to 1.0 µm, but may be larger under high relative humidity conditions. Particles in the nucleation, Aitken, and accumulation modes are referred to as fine particles. PM2.5 is practically defined as PM collected by a sampler with a 50% cut-point of 2.5 µm aerodynamic diameter. Within fine particles, those with a diameter ≤0.1 µm are called ultrafine particles (UFPs) and contain particles in both the nucleation mode and the Aitken mode. Coarse particles are mechanically generated and usually have diameters >1.0 µm (1).
Particle size, along with breathing pattern, determines what fraction of particles, as a function of size, deposit in various regions of the respiratory tract (2). Because historically particle measurements have focused on PM10 and more recently on PM2.5, most health studies have examined various health endpoints in relation to ambient concentrations of PM10 and/or PM2.5. More recently increasing concerns have been raised on potential adverse health effects of UFPs (3-13). However, there exist challenges in studying health effects of UFPs, one of which is what metrics are most appropriate for these particles that make up a very large number concentration but contribute little to mass concentrations.
In addition to number concentration, surface area concentration of UFPs has been suggested to be a metric of biological effectiveness (11). This is because UFPs have substantially larger surface areas per unit mass compared to coarser particles and also because surface area may be a better determinant for the number of molecules on the particle surface. These surface molecules may be the “active ingredient” that interacts with bio-molecules in the respiratory tract, leading to biological consequences such as inflammation (11).
Fractional exhaled nitric oxide (FeNO) is a well-established biomarker of pulmonary inflammation (14-16). Nitric oxide (NO) in the respiratory tract is generated by the catalytic action of inducible NO synthases (iNOS) in various cells (17); and iNOS can be activated to increase the production of NO by pro-inflammatory cytokines when pulmonary inflammation occurs (18). FeNO has been used clinically as a pulmonary inflammatory marker to examine asthmatic patients (16,19) and has also been used in epidemiological studies as a sensitive and reliable biomarker of inflammatory effects associated with exposure to ambient PM10 and PM2.5 (14,15,20,21).
To investigate what metrics of particles are of biological relevance, we conducted the present study to examine the relationships between particles of various sizes and FeNO in elementary-school children. We measured size-resolved particles from 3 to 10 µm, enabling us to classify particles into each of the four size-modes described above. We measured or estimated mode-specific concentrations by number, surface area, active surface area, and volume and assessed these metrics in relation to FeNO.
Methods
Measurements of particles
A Twin Differential Mobility Particle Sizer System (TDMPS), coupled with an Aerosol Particle Sizer (APS), was used to measure PM number concentrations. The TDMPS system consisted of two DMA and two CPC modules, measuring particles from 3 to 20 nm and from 20 to 800 nm (Stokes diameter), respectively. The APS was used to measure PM with a size range from 500 to 10 µm (aerodynamic diameter). The time resolution for the TDMPS-APS system was 10 minutes. The instrument was placed on the roof of a 6-floor building located at the center of Peking University’s main campus, located in western Beijing. The building on which the sampler was placed was not adjacent to main traffic roads (300 meters away from the nearest traffic road).
Calculations of particle number, surface, active surface concentrations
The TDMPS-APS system measured diameter-normalized number concentrations of particles. We calculated number, surface area and volume concentrations of particles using Eqs. [1-3] (22).
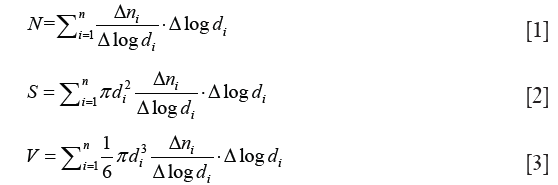
where di is the diameter of particles; Δni/Δlogdi is diameter-normalized number concentration of particles with a diameter of di. N, S and V are number, surface area, and volume concentrations of particles in a defined size range from d1 to dn, respectively.
Active surface area, or Fuchs’ surface area, has been considered to be the surface area available for interaction with ions (23). We calculated the active surface area using Eq. [4],
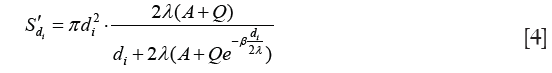
where S'di is the active surface area concentration of particles with diameter of di; λ=14.5 nm is the mean free path of the H+(H2O)6 ion; A=1.170, Q=0.525, and β=0.78 (these are called Cunningham fit parameters) (24).
Estimation of particle deposition in the respiratory tract
Presumably only the fraction of inhaled particles that have deposited within the respiratory tract can interact with bio-molecules and cells and consequently lead to adverse biological effects. The fraction of inhaled particles deposited in the respiratory tract varies with the size of particles, the type of breathing (oral or nasal), and the exertion level [which determines the amount of air inhaled, i.e., minute ventilation which equals the breathing rate (min−1) times the volume of air per breath]. The deposition fraction also varies with the size and the health of the lung. Fractions that particles deposit in various regions of the respiratory tract can be estimated with dosimetric models. We used the dosimetry model developed by The International Commission on Radiological Protection (ICRP) (25) to estimate, respectively, the fractions of the inhaled number, surface area, and volume concentrations of particles from 3 nm to 10 µm that would deposit in different regions of the respiratory tract, namely the extrathoracic (ET including head, nose, and larynx), the tracheobronchial (TB including trachea and other ciliated bronchi), the alveolar (AL i.e., the air exchange region), and the total deposition (TO i.e., sum of ET, TB and AL) in the respiratory tract. This model includes a description of the structure of the respiratory tract and its dimensions and considers deposition by the mechanisms of impaction, sedimentation, and diffusion. Model input parameters include particle properties (size, density, shape factor, and concentration) and breathing pattern (tidal volume, breathing frequency, and mode of breathing). Examples of such deposition fractions, varying with breathing patterns, are given in previous publications (26). The ICRP models were developed for particles in the size range of 0.001–100 µm and, thus, suites the particle size range measured in the present study. The use of this dosimetric model to calculate the deposition of surface area in various regions of the respiratory tract has been described previously (23).
Measurements of SO2, NO2, ambient temperature and RH
Daily average concentrations of SO2 and NO2 were measured in Beijing’s urban area and provided by Beijing Municipal Environmental Center. Ambient temperature and relative humidity (RH) were measured at the same location where particle numbers were monitored at the main campus of Peking University.
Study subjects
By taking advantage of the existing PM monitoring work as described above, we designed a panel study in which children were recruited from the Peking University Elementary School, located on the same campus and within 0.5 km from the PM monitoring site. The students were children of the faculty and staff of the university and resided on or near the campus. Study subjects were selected through a screening questionnaire and enrolled into the study after informed consent forms had been signed by their parents. Children who had physician-diagnosed asthma, allergic, infectious and other chronic diseases were excluded from the present study. Seventeen healthy children (8 males and 9 females) participated in the study. Their age range was 9 to 12 years old. Each enrolled child was measured for their FeNO once per day during each of the three measurement sessions: the first in the fall of 2005, the second in the winter of 2005, and the third in the spring of 2006. Each session lasted for two consecutive weeks excluding weekend days. This measurement scheme resulted in up to 30 days of measurement for each child. All measurements were made consistently around noon during the children’s lunch break at the school.
Study children were asked to fill out a time/activity diary every day during the sampling period. Collected information included dates (if any) when they had respiratory infection and what medication they had used (if any). Two children were not used in the data analyses because of the occurrence of respiratory infections. For the entire sampling period, 9 children had data for all the 30 days of measurements, four had data for 29 days and two had data for 27 days. The baseline information of children’s medical history and exposure were shown in Table S1.

Full table
Measurement of FeNO
We used a common method to measure FeNO (27,28). Each child remained seated for 5 min to relax prior to the breath collection. We collected the exhaled breath into an aluminum bag using an exhaled breath collector that scrubbed ambient NO with an activated carbon filter. The exhaled air flow was controlled at 80±5 mL/s because FeNO concentration is dependent on the flow rate of exhaled breath (29). By discarding the first two breaths, we collected exhaled air from the upper and lower airway tract, but not from the nasal region (21). Approximately 1.5 L exhaled breath air was collected each time for the analyses of FeNO using a NOx-NO2-NO analyzer (Model 42C, Thermo Inc., Franklin MA, US). We tested the stability of NO in the air bags and found that concentrations varied less than 3.6% when analyzed within 6 hours following collection. All the samples were analyzed within 2 hours of sample collection. Based on 5 sets of triplicate analyses, the FeNO measurement method had a relative standard deviation (RSD, n=15) of <10%. The method had a detection limit of 0.40 ppb FeNO.
Measurement of the lung function
In addition to FeNO, we also measured children’s lung function, i.e., forced vital capacity (FVC) and forced expiratory volume in one second (FEV1), in the last two sessions. The measurement was taken by a spirometry (Vitalograph 6800).
Statistical analysis
Linear mixed effects models were used to estimate the association between PM concentrations and FeNO and the lung function parameters. In the models, fixed variables included PM concentration, co-pollutant concentration, ambient temperature, and RH; and random effect variables include subject and date of measurement. The method can be described as follows {Eq. [5]}.

where Yklm is FeNO or lung function value for the mth subject in the kth season on the lth day; µ is estimated grand mean of FeNO of the entire study period; αi is the effects of the ith measure of PM (number, surface area, active surface area, or volume concentration) in different size ranges and their deposition in different regions of respiratory tract. βj is the effects of the jth factor other than PM, i.e., NO2, SO2, temperature and RH; ak represents the effect of the kth season (fall, winter and spring); bl(k) represents the effects of the lth day in the kth season; and εklm represents the random error term of FeNO concentration for the mth subject in the kth season and the lth day.
Results
PM size distributions and concentrations
Daily averages of PM in different size ranges are summarized for number, surface area, active surface area, and volume concentrations and by season of measurement in Table 1. In examining the size distribution by particle number concentrations on individual days and taking October 10th, 2005 as an example (Figure 1), we found it reasonable to classify all particles <800 nm into three modes, i.e., the nucleation mode (3 to 22 nm), the Aitken mode (23 to 70 nm) and the accumulation mode (71 to 800 nm). There was only one mode shown for PM size between 1 and 10 µm (the coarse mode, PM10-1) (Figure 2A). Hence, we calculated number concentrations of coarse-mode particles for the size range from 1 to 10 µm.

Full table


Figure 2 shows the size distribution of particles over the whole sampling period (30 days) by number, surface area, and volume concentrations. There appeared to be just two modes for particle size distributions by surface area or by volume concentration (Figure 2B,C). And it showed that the surface area of airborne PM was dominated by particles in the range of 70 to 800 nm; and the coarse mode (1–10 µm) contributed little to the surface area concentration. However, coarse mode particles contributed substantially to the volume concentrations. Therefore, we calculated the surface area and volume concentrations in two size ranges, i.e., from 70 to 800 nm (the accumulation mode) and 1 to 10 µm (the coarse mode).
Particulate matter concentrations deposited in different regions of respiratory tract, i.e., ET, TB, AL, were estimated for the entire size range (from 3 nm to 10 µm). As shown in Table 2, among the three regions (ET, TB, and AL), AL was the region where the majority of the particles were expected to deposit.

Full table
FeNO
Concentrations of FeNO are shown in Figure 3 by subject and by season. The grant mean (± SD) of FeNO concentrations across all subjects and all seasons was 7.3±4.4 ppb, whereas season-specific means (± SD) were 5.7±2.5 ppb for the fall session, 9.4±8.4 ppb for the winter session, and 11.2±9.0 ppb for the spring session. There was no significant difference in FeNO concentrations between boys and girls. However, we found significant differences in FeNO across three seasons.

Relationships between FeNO and PM metrics
FeNO (in ppb) per unit increase in each PM metric (e.g., number, surface area, active surface area, or volume concentrations) was calculated from the mixed effects model and reported as mean and 95% confidence interval in Figure 4A. We found that an interquartile range (IQR) increase in number concentration of nucleation-mode particles was associated with a significant 4.70 ppb decrease in FeNO. In contrast, an IQR increase in number concentration of Aitken-mode particles was associated with a significant 2.45 ppb increase in FeNO; and each IQR increase in number concentration of accumulation-mode particles was associated with a significant 6.20 ppb increase in FeNO. However, when Aitken-mode particles and nucleation-mode particles were combined into a single category as ultrafine particles (UFPs in size range from 3 to 93 nm), we did not find a significant association between FeNO and number concentration of UFPs. Furthermore, we did not find a significant association between FeNO and number concentration of coarse particles (1 to 10 µm) (see Figure 4A).

Both nucleation-mode particles and Aitken-mode particles had small surface area concentrations and small volume concentrations which were not associated with FeNO. In terms of surface area concentrations, only accumulation-mode particles were significantly and positively associated with FeNO (see Figure 4A). Similarly, the active surface area of accumulation-mode particles, but not coarse-mode particles, was significantly and positively associated with FeNO. In terms of volume concentration, not only accumulation-mode particles but also coarse-mode particles were significantly and positively associated with FeNO (Figure 4A). The effect estimates appeared to be more than 2-fold larger for finer particles, as each IQR increase in volume concentration of accumulation-mode particles was associated with a 1.87 ppb increase in FeNO, compared to a 0.81 ppb increase in FeNO per IQR increase in volume concentration of coarse-mode particles. The estimated increases in FeNO per unit increases in volume concentrations of accumulation-mode and coarse particles were equally 0.028 ppb.
Changes of FeNO associated with an IQR increase in different particle metrics for particles deposited in the respiratory tract are shown in Figure 4B. In terms of number concentration, particles deposited in the three regions and the entire respiratory tract were all significantly but negatively associated with FeNO. In terms of surface area concentration or volume concentration, particles deposited in the three regions and in the entire respiratory tract were all significantly and positively associated with FeNO.
The results shown in Figure 4 were obtained from models controlled NO2 and SO2. We also conducted some sensitivity analysis without controlling for these to co-pollutants, and found that the involvement of the two co-pollutants did not affect the significance of the associations between FeNO and measures of PM, except the associations between FeNO and number/area concentrations of the coarse particles (see Table S2).

Full table
Discussion
In a previous study, Koenig and coauthors reported that FeNO concentrations in 19 asthmatic children were 19.9±12.4 ppb in a winter measurement session and 12.7±6.7 in a spring session (21). These concentrations were higher than the overall mean, 7.3±4.4 ppb, of FeNO concentration observed in the present study. It is reasonable since the subjects in the Koening et al study were asthmatic children who were more susceptible to air pollution induced inflammation than non-asthmatic children. This is directly supported by a previous study (16) in which a higher average FeNO concentration was observed in asthmatic children (13.4±1.4 ppb) compared to a non-asthmatic control group (7.2±1.0 ppb). The FeNO overall mean concentration observed in our present study was remarkably similar to the mean concentration measured in the non-asthmatic children of the previous study (16).
Although previous studies have reported associations between FeNO concentrations and particle (PM2.5) mass concentrations (20,21) or UFP number concentrations (30,31), the present study is perhaps the first to examine other metrics of particles with various sizes. Based on hypothesized mechanisms of particle interaction with the respiratory tract, some of these metrics (e.g., surface area) have been thought to be more biologically relevant than mass concentrations, especially for particles in the ultrafine size range (11). Below we discuss different metrics of ambient particles with various sizes (covering the entire size range from 3 to 10 µm) in relation to lung inflammation (FeNO).
Number concentrations in relation to FeNO
For practical and operational conveniences, atmospheric particles with a diameter ≤0.1 um (100 nm) have been referred as to ultrafine particles (UFPs) and their number concentrations have often been measured using relatively simple instrument such as condensation particle counter (CPC) without further size resolution. However, UFPs as a whole contain particles of two modes, i.e., the nucleation and the Aitken modes. These two modes may be inherently different in physicochemical properties, due to their different formation mechanisms, and hence may exert different toxicities. In the present study, number concentration of UFPs as a whole showed no significant association with FeNO; whereas number concentration of nucleation-mode particles showed a significant but negative association, while number concentration of Aitken-mode particles exhibited a significant and positive association with FeNO. This result indicates that lumping particles in the nucleation mode and in the Aitken mode into UFPs led to a net null effect, as particles in these two modes showed opposite effects on FeNO. This finding was consistent with two previous studies that had reported non-significant associations between UFP number concentration and FeNO (30,31).
Our findings on the negative association between nucleation-mode particles and FeNO are intriguing for several reasons. Firstly, particles may not only induce NO production in the respiratory tract reflecting inflammation but may also consume NO generated in the endothelial system. In a recent study, Miller et al. [2009] found that diesel exhaust particles could consume endothelium-derived NO by oxygen-centered free radicals, such as superoxide (32). When the amount of NO eliminated by particle-related free radicals exceeds that induced in the lung, we could expect a negative association between particles and FeNO. Because nucleation-mode particles are small enough in size to directly enter the circulation system, it is reasonable to expect these particles, as opposed to larger particles, could suppress the endothelial production of NO. Secondly, freshly generated nucleation-mode particles can easily react with other substances or aggregate with each other to form larger particles; and consequently, these particles have a short residence life in the atmosphere (from seconds to minutes) (13). Therefore, concentrations of nucleation-mode particles measured at a fixed site may not precisely represent exposures of subjects even when they lived and attended school near the monitoring site as in our study situation. Wittmaack et al. [2007] suggested that particles with the size <10 nm were of questionable relevance with respect to environmental health effects, because of a fast fall-off in number concentration at particles sizes below 10 nm compared to particles sizes between 20 and 200 nm (33,34). Thirdly, nucleation-mode and accumulation-mode particles showed a significant negative correlation (spearman correlation coefficient r=−0.74, P<0.0001) in the current study. This means that the negative association of FeNO with nucleation-mode particles may be simply a reflection of the negative association of nucleation-mode particles with accumulation-mode particles. The number concentration of atmospheric particles was dominated by UFPs with only a neglectable contribution by coarse-mode particles (PM10-1) (Figure 2A). In the present study, we measured number concentrations of PM10-1 thousands-fold lower than those of particles with diameters <800 nm; and it is not surprising to see no significant associations of the number of coarse-mode particles with FeNO, as shown in Figure 4A.
In the association analysis between the lung function and PM, we found that the nucleation-mode particles were significantly and positively associated with FEV1 and FVC (over the predicted value) (see in Figures S1,S2), and this result provided additional evidence on the negative association between nucleation-mode particle with FeNO due to, in part, the consumption of NO generated in the endothelial system.


Surface area concentrations in relation to FeNO
Surface area has been suggested to be a most biologically relevant metric of ultrafine particles or nanoparticles considering that surface interaction with bio-molecules (e.g., proteins and lipids) may be the first key step leading to biological consequences (11,35). In the present study, we indeed found a significant and positive association of FeNO with both the surface area and the active surface area concentrations of accumulation-mode particles (70–800 nm) (Figure 4A). As expected and shown in Figure 2B, coarse-mode particles (PM10-1) had a very small surface area concentration which showed no significant association with FeNO.
Volume concentrations in relation to FeNO
Volume concentration is a proxy of mass concentration of particles. Previous studies have consistently reported that FeNO was associated with mass concentration of PM2.5 (20,21,36). Therefore, we expected to observe a significant association between volume concentrations and FeNO concentrations in the present study. This is indeed the case, as we found significant associations of FeNO with volume concentrations of both accumulation-mode and coarse-mode particles (Figure 4A). Finer particles (nucleation-mode and Aitken-mode) contributed little to volume (mass) concentrations (Figure 2C) their volume concentrations were not significantly associated with FeNO.
Metrics for deposited particles in relation to FeNO
The physical exertion has been recognized to affect particle depositions in lung (37). Our estimation of particle’s deposition factions in various regions of lung is based on subjects’ activities within a routine school day, and the breathing patterns during the exposed period may include sleeping, resting, walking, jogging, and so on.
As shown in Figure 4B, total number concentration of particles deposited in each of the three regions and the entire respiratory tract showed a significant but negative association with FeNO. This is consistent with our findings on number concentrations of ambient particles (Figure 4A), because nucleation-mode particles had large number concentrations of particles deposited in the three regions and the entire respiratory tract (see Figure 5A). In a similarly consistent fashion, we observed a significant and positive association of FeNO with total surface area concentration of particles deposited in each of the three regions and the entire respiratory tract, because total surface area concentration was mainly driven by accumulation-mode particles (Figure 5B) that were positively associated with FeNO (Figure 4A). Not surprisingly, we observed the same consistency in terms of volume concentrations. The volume concentrations of particles deposited in the three regions and the entire respiratory tract each showed a significant and positive association with FeNO. As shown in Figure 5C, accumulation-mode and coarse-mode particles dominated the volume concentrations of particles deposited in the three regions and the entire respiratory tract. These findings suggest that total surface area concentration and total volume concentration, but not total number concentration, of particles deposited in the respiratory tract may be relevant metrics in terms of pulmonary inflammation. The number concentration of particles deposited may be a relevant metric in terms of endothelial function, assuming nucleation-mode particles directly enter the circulation system and disrupt endothelial NO production.

Uncertainties and limitations
Ambient particles are only part of the complex urban air pollution mixture. Previous studies have reported FeNO associations with not only PM2.5 or PM10 but also other pollutants such as NO2, black smoke, etc. (20,21,38). Therefore, PM effects can be potentially confounded by effects of other pollutants. In the present study, we included NO2 and SO2 as covariates in the mixed-effects models to control for confounding from these pollutants. We found a significant association of FeNO with SO2 but not with NO2. However, adjusting for either pollutant did not change the associations between FeNO and various PM metrics, as described and discussed earlier (1).
Ultrafine particles, especially those in the nucleation mode, have a short residence time in the atmosphere, making it difficult to accurately assess exposure of free-living individuals. Personal exposure monitoring is, thus, more desirable to use for exposure assessment. This can be done for total UFP using a portable condensation particle counter (CPC) (39,40) but is impractical for size-fractionated particles in various modes as done in the present study. The TDMPS and APS would be impossible to be used in personal measurements. In order to make the monitoring data as much as possible to reflect actual exposures, we selected the children whose school and residences were both in very close proximity to the monitoring site. However, there still exist some inevitable uncertainties associated with the use of fixed-site monitoring data in our analysis of particle-FeNO relationships.
Conclusions
Urban ambient particles in the entire size range from 3 to 10 µm could be classified by size into nucleation-mode, Aitken-mode, accumulation-mode, and coarse-mode particles. Various metrics (number, surface area, active surface area, and volume concentration) of these particles in the air and as deposited in the respiratory tract were assessed in relation to fractional exhaled nitric oxide (FeNO), a well-established biomarker of lung inflammation. In terms of number concentration, ambient particles in the Aitken mode and in the accumulation mode were significantly and positively associated with FeNO. In terms of surface area and active surface area concentrations, only ambient particles in the accumulation mode were significantly and positively associated with FeNO. In terms of volume concentration (a proxy to mass concentration), ambient particles in both the accumulation mode and the coarse mode were significantly and positively associated with FeNO. In contrast, ambient particles in the nucleation mode were significantly and negatively associated with FeNO, suggesting that these nano-sized particles may be small enough to directly enter the circulation system and may contain reactive species that can suppress endothelial production of NO. Results from analyses of the relationships between FeNO and metrics for particles deposited in the respiratory system were consistent with these findings. Because commonly-defined UFPs (all particles ≤100 nm) consist of both nucleation-mode and Aitken-mode particles that showed opposite effects on FeNO, total number concentration of UFP as a lump-sum may diminish the biological relevance as we observed no significant association between FeNO and UFP number concentration.
Acknowledgements
We thank students from Dr. Tong Zhu’s laboratory, including Dr. Yu Shang, Dr. Zefeng Zhang, Dr. Defeng Zhao, Dr. Yi Li, Dr. Bo Yao, Weiwei Lin, and who helped with the sample collection, and thanks for the cooperation of all the subjects, their parents, and the Peking University Elemental School.
Funding: This work was supported by the Ministry of Science and Technology of China (No. 2015CB553401, 2008AA062503) and the National Natural Science Foundation of China (Grant No. 41421064, 20637020). Dr. Zhang’s research is supported, in part, by an NIEHS center grant awarded to University of Southern California (#5P30ES007048).
Footnote
Conflicts of Interest: The authors have no conflicts of interest to declare.
Ethical Statement: Unfortunately, since there was no requirement on the IRB 14 years ago when we conducted the study, we did not request an IRB review. Written informed consent was obtained from all patients.
References
- U.S. Environmental Protection Agency (EPA). Air quality criteria for particulate matter. Research Triangle Park, NC: U.S. Environmental Protection Agency 2004 Contract No.: EPA/600/P-99/002aF.
- ICRP. Human respiratory tract model for radiological protection. A report of a Task Group of the International Commission on Radiological Protection. Ann ICRP 1994;24:1-482. [PubMed]
- Kreyling WG, Semmler-Behnke M, Moller W. Ultrafine particle-lung interactions: does size matter? J Aerosol Med 2006;19:74-83. [Crossref] [PubMed]
- Bräuner EV, Forchhammer L, Møller P, et al. Exposure to ultrafine particles from ambient air and oxidative stress-induced DNA damage. Environ Health Perspect 2007;115:1177-82. [Crossref] [PubMed]
- Stewart JC, Chalupa DC, Devlin RB, et al. Vascular effects of ultrafine particles in persons with type 2 diabetes. Environ Health Perspect 2010;118:1692-8. [Crossref] [PubMed]
- Hertel S, Viehmann A, Moebus S, et al. Influence of short-term exposure to ultrafine and fine particles on systemic inflammation. Eur J Epidemiol 2010;25:581-92. [Crossref] [PubMed]
- Andersen ZJ, Olsen TS, Andersen KK, et al. Association between short-term exposure to ultrafine particles and hospital admissions for stroke in Copenhagen, Denmark. Eur Heart J 2010;31:2034-40. [Crossref] [PubMed]
- Alessandrini F, Weichenmeier I, van Miert E, et al. Effects of ultrafine particles-induced oxidative stress on Clara cells in allergic lung inflammation. Part Fibre Toxicol 2010;7:11. [Crossref] [PubMed]
- Belleudi V, Faustini A, Stafoggia M, et al. Impact of fine and ultrafine particles on emergency hospital admissions for cardiac and respiratory diseases. Epidemiology 2010;21:414-23. [Crossref] [PubMed]
- Delfino RJ, Staimer N, Tjoa T, et al. Association of biomarkers of systemic inflammation with organic components and source tracers in quasi-ultrafine particles. Environ Health Perspect 2010;118:756-62. [Crossref] [PubMed]
- Nel A, Xia T, Madler L, et al. Toxic potential of materials at the nanolevel. Science 2006;311:622-7. [Crossref] [PubMed]
- Oberdorster G, Oberdorster E, Oberdorster J. Nanotoxicology: an emerging discipline evolving from studies of ultrafine particles. Environ Health Perspect 2005;113:823-39. [Crossref] [PubMed]
- Oberdorster G, Utell MJ. Ultrafine particles in the urban air: To the respiratory tract - And beyond? Environ Health Perspect 2002;110:A440-A1. [Crossref] [PubMed]
- van Amsterdam JGC, Verlaan BPJ, Van Loveren H, et al. Air pollution is associated with increased level of exhaled nitric oxide in nonsmoking healthy subjects. Arch Environ Health 1999;54:331-5. [Crossref] [PubMed]
- van Amsterdam JG, Nierkens S, Vos SG, et al. Exhaled nitric oxide: a novel biomarker of adverse respiratory health effects in epidemiological studies. Arch Environ Health 2000;55:418-23. [Crossref] [PubMed]
- Artlich A, Hagenah JU, Jonas S, et al. Exhaled nitric oxide in childhood asthma. Eur J Pediatr 1996;155:698-701. [Crossref] [PubMed]
- Lane C, Knight D, Burgess S, et al. Epithelial inducible nitric oxide synthase activity is the major determinant of nitric oxide concentration in exhaled breath. Thorax 2004;59:757-60. [Crossref] [PubMed]
- Kamosinska B, Radomski A, Man SF, et al. Role of inducible nitric-oxide synthase in regulation of whole-cell current in lung epithelial cells. J Pharmacol Exp Ther 2000;295:500-5. [PubMed]
- Vogelberg C. Exhaled NO - a critical evaluation with respect to clinical relevance and pulmonary function testing. Allergologie 2008;31:91-8. [Crossref]
- Adamkiewicz G, Ebelt S, Syring M, et al. Association between air pollution exposure and exhaled nitric oxide in an elderly population. Thorax 2004;59:204-9. [Crossref] [PubMed]
- Koenig JQ, Jansen K, Mar TF, et al. Measurement of offline exhaled nitric oxide in a study of community exposure to air pollution. Environ Health Perspect 2003;111:1625-9. [Crossref] [PubMed]
- Seinfeld JH, Pandis SN. Atmospheric chemistry and physics: from air pollution to climate change. New York: John Wiley & Sons; 1998.
- Wilson WE, Stanek J, Han HS, et al. Use of the electrical aerosol detector as an indicator of the surface area of fine particles deposited in the lung. J Air Waste Manag Assoc 2007;57:211-20. [Crossref] [PubMed]
- Pui DYH, Fruin S, Mcmurry PH. Unipolar diffusion charging of ultrafine aerosols. Aerosol Sci Technol 1988;8:173-87. [Crossref]
- International Commission on Radiological Protection (ICRP). Human respiratory tract model for radiological protection: a report of a task group of the International Commission on Radiological Protection. Oxford, United Kingdom1994 Contract No.: ICRP publication 66, Annals of the ICRP.
- Brown JS, Wilson WE, Grant LD. Dosimetric comparisons of particle deposition and retention in rats and humans. Inhal Toxicol 2005;17:355-85. [Crossref] [PubMed]
- ATS/ERS. Recommendations for Standardized Procedures for the Online and Offline Measurement of Exhaled Lower Respiratory Nitric Oxide and Nasal Nitric Oxide. Am J Respir Crit Care Med 2005;171:912-30. [Crossref] [PubMed]
- Gong J, Zhu T, Zhang J, et al. Measurement of nitric oxide in human exhaled air as a biomarker of the health effects of ultrafine particles. Environmental Chemistry 2006;25:768-71. (in Chinese).
- Silkoff PE, McClean PA, Slutsky AS, et al. Marked flow-dependence of exhaled nitric oxide using a new technique to exclude nasal nitric oxide. Am J Respir Crit Care Med 1997;155:260-7. [Crossref] [PubMed]
- McCreanor J, Cullinan P, Nieuwenhuijsen MJ, et al. Respiratory effects of exposure to diesel traffic in persons with asthma. N Engl J Med 2007;357:2348-58. [Crossref] [PubMed]
- Strak M, Boogaard H, Meliefste K, et al. Respiratory health effects of ultrafine and fine particle exposure in cyclists. Occup Environ Med 2010;67:118-24. [Crossref] [PubMed]
- Miller MR, Borthwick SJ, Shaw CA, et al. Direct impairment of vascular function by diesel exhaust particulate through reduced bioavailability of endothelium-derived nitric oxide induced by superoxide free radicals. Environ Health Perspect 2009;117:611-6. [Crossref] [PubMed]
- Wittmaack K. In search of the most relevant parameter for quantifying lung inflammatory response to nanoparticle exposure: Particle number, surface area, or what? Environ Health Perspect 2007;115:187-94. [Crossref] [PubMed]
- Wittmaack K. Advanced evaluation of size-differential distributions of aerosol particles. Journal of Aerosol Science 2002;33:1009-25. [Crossref]
- Donaldson K, Brown D, Clouter A, et al. The pulmonary toxicology of ultrafine particles. J Aerosol Med 2002;15:213-20. [Crossref] [PubMed]
- Mar TF, Jansen K, Shepherd K, et al. Exhaled nitric oxide in children with asthma and short-term PM2.5 exposure in Seattle. Environ Health Perspect 2005;113:1791-4. [Crossref] [PubMed]
- Mitsakou C, Housiadas C, Eleftheriadis K, et al. Lung deposition of fine and ultrafine particles outdoors and indoors during a cooking event and a no activity period. Indoor Air 2007;17:143-52. [Crossref] [PubMed]
- Steerenberg PA, Nierkens S, Fischer PH, et al. Traffic-related air pollution affects peak expiratory flow, exhaled nitric oxide, and inflammatory nasal markers. Arch Environ Health 2001;56:167-74. [Crossref] [PubMed]
- Vinzents PS, Moller P, Sorensen M, et al. Personal exposure to ultrafine particles and oxidative DNA damage. Environ Health Perspect 2005;113:1485-90. [Crossref] [PubMed]
- Cattaneo A, Garramone G, Taronna M, et al. Personal exposure to airborne ultrafine particles in the urban area of Milan. Journal of Physics: Conference Series 2009;151:012039. [Crossref]

