
CT-based radiomics features analysis for predicting the risk of anterior mediastinal lesions
Introduction
Due to the wide range of types involved in anterior mediastinal lesions, a differential diagnosis and risk evaluation bring continuous challenges to clinicians (1). Thymic epithelial tumors are the most primary neoplasms in the anterior mediastinum (2), and are histologically divided by the World Health Organization (WHO) into type A, type AB, type B1, type B2, type B3, and type C (heterogeneous thymic carcinomas), based on the ratios of lymphocytes to epithelial cells and the morphology of epithelial cells (3-5). Also, there is a simplified classification that defines type A, AB, and B1 thymomas as low-risk and type B2 and B3 thymomas and type C as high-risk lesions. This simplified risk classification is closely related to the patients’ outcome and the prognosis according to the WHO classification. It is reported that high-risk thymic epithelial tumors have a much poorer prognosis and a higher recurrence rate when compared with low-risk thymic epithelial tumors (6). In addition to thymic epithelial tumors, some benign masses with good prognosis, such as hemangiomas and cysts, were classified as being low-risk or high-risk malignant masses like lymphoma, which are also commonly found in the anterior mediastinum. Accurate pre-treatment evaluation of risks on anterior mediastinal lesions has become crucial because of its impact on surgical planning and prognosis assessment (7). Hence, an effective and objective approach is urgently needed to estimate the clinical risk of anterior mediastinal masses before treatment.
Chest CT scans are the routine examination in delineating anterior mediastinal masses (8). However, there are no specific characteristics concerning the differential diagnosis of anterior mediastinal lesions (9). Recently, radiomics has aroused increasing attention, mainly due to its ability to extract large quantities of high-throughput imaging features, and transform medical images into mineable high-dimensional data. The subsequent quantitative analysis of these data can offer help in assessing the risk of lesions in the anterior mediastinum based on CT (10-12). Radiomics has been applied in the grading and staging of tumors, including those of lung cancers (13), renal carcinomas, breast carcinomas, and colorectal adenocarcinomas. It has also found use in assessing anterior mediastinal lesions, including in estimating thymic epithelial tumors’ grading and staging (14), distinguishing solid and cyst masses (15), and identifying histological subtypes of thymic epithelial tumors (16). Nevertheless, only quantitative texture analysis (QTA), one branch of radiomics analyses, has been adopted.
This study aimed to build a CT-based radiomics model and validate its predictive ability on high-risk lesions from low-risk ones in the anterior mediastinum.
Methods
Patients
This retrospective study received the approval from the Institutional Review Board, and informed consent was obtained from all patients. A total of 298 patients from February 2013 to March 2018, including 130 for the unenhanced computed tomography (UECT) scan (59 males and 71 females; age range, 17–86 years old; mean, 52.26±11.08 years old) and 168 for the contrast-enhanced CT (CECT) scan (72 males and 96 females; age range 18–86 years old; mean, 52±11.29 years old) affected by anterior mediastinal masses were retrospectively retrieved from the China-Japan Union Hospital and the Second Hospital of Jilin University. Patients were selected according to the following inclusion principles:
- Histopathological diagnosis of anterior mediastinal lesions obtained by biopsy, mediastinoscopy, or surgery (Table 1);/
- Good quality UECT and CECT images with the same scan parameters for radiomics analysis;
- No previous chemotherapy, radiation therapy, or biopsy.
Because teratomas have quite a specific performance on CT scan and can be easily distinguished by visual observation, we excluded teratomas from this analysis.

Full table
CT images
UECT and CECT images were scanned by Toshiba Medical Systems CT scanners (Tochigi, Japan) and GE Healthcare CT scanner (Waukesha, WI). Automatic tube current modulation techniques were adopted with the tube voltage set at 120 kVp. The noise index of the SD was set as 11.6 and 13.0 for the GE and the Toshiba scanner respectively (80–100 mL) was injected at the speed of 2–3 mL/s, and the venous-phase CECT scan was then performed for 60 s. The UECT and CECT images were all reconstructed with a section thickness of 5 mm and an image slice matrix of 512×512.
Lesion delineation and segmentation
All the UECT and CECT images were loaded into the RadCloud platform (Huiying Medical Technology Co., Ltd., Beijing, China). Volume of interests (VOIs) generally considered to be lesions were delineated on both UECT and venous-phase CECT images by a radiologist who had 3 years’ clinical experience but was blinded to the clinical and histological information. Afterward, the VOIs were checked by a senior radiologist with more than 5 years of clinical experience, who decided on the lesions’ borders when a discrepancy occurred (10) (Figure 1).

Feature extraction
In total, 1,029 quantitative imaging features were extracted from UECT and venous-phase CECT images with the RadCloud platform. They were classified into four groups. Group 1 covered the intensity features (including 19 descriptors) that quantitatively delineated the distribution of voxel intensities within the CT image through the basic metrics found in common. Group 2 (shape features) consisted of 15 three-dimensional (3D) features reflecting the shape and size of the target region. Texture features were divided into three types based on the calculations obtained from the grey level co-occurrence matrix, gray level size zone matrix, and grey level run length matrix. A total of 69 features were able to be quantified as regions with heterogeneity differences and were classified into Group 3 (texture features). The above three groups all extracted features from the VOIs of the original image.
Group 4 (higher-order features), with 966 features, included the intensity and texture features that were derived from the wavelet transformation and the filters of the original image. Furthermore, exponential, square, square root, logarithm, and wavelet (wavelet-LLL, wavelet-HHH, wavelet-HLL, wavelet-HHL, wavelet-LLH, wavelet-HLH, wavelet-LHL, wavelet-LHH) were derived from the original images that were used as filters.
Radiomics features selection and machine learning
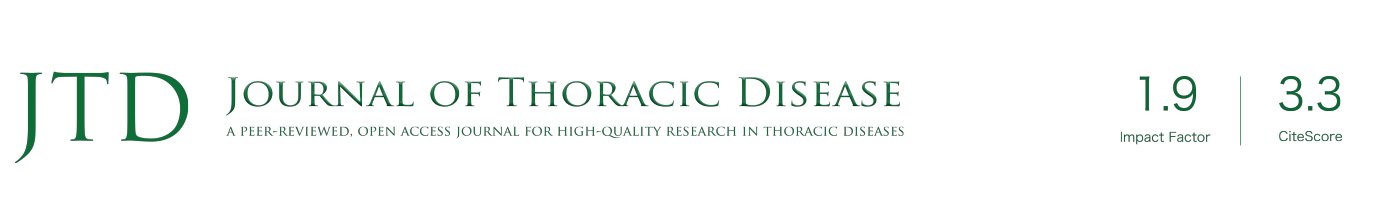
All statistical analyses were performed in Python (Version 2.7). We used Least absolute shrinkage and selection operator (Lasso) algorithm methods for the feature selection, in order to single out the optimal features. In this process, we used 5- and 6-fold validation to find the best parameters with 3,000 iteration.
The cost function of LASSO method is:
X: the matrix of radiomic features; y: the vector of the sample labels; n: the number of samples; w: the coefficient vector of the LASSO model;  : the LASSO penalty with the constant α and the
  m of coefficient vector
  .
.
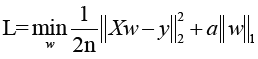
We used Logistic regression (LR) classifier with 8-fold validation on UECT selected features and 3-fold validation LR classifier on CECT selected features.
The cost function of LR as following:
X: the matrix of radiomic features; y: the vector of the sample labels; w: the coefficient vector of the LR model; C: inverse of regularization strength.
Predictive performance of machine learning
The receiver operating characteristics (ROC) curve analysis was employed to evaluate the prediction ability of the selected radiomics features. The optimal cutoff value was selected as the point when both the sensitivity and specificity were maximal. In the area under the curve (AUC), sensitivity and specificity were calculated in both the training and validation sets of UECT and CECT.
The workflow is shown in Figure 2.

Results
Clinical characteristics
A total of 298 patients (collected from February 2013 to March 2018) included 130 for UECT scan (28 high-risk lesions, 102 low-risk lesions; lesion volume, 132.21±229.18 and 52.57±96.08 cm3, respectively) and 168 for CECT scan (88 high-risk lesions, 90 low-risk lesions; lesion volume, 128.85±227.17 and 53.14±96.45 cm3, respectively). The differences in lesion volume between the high-risk and low-risk sets in UECT and CECT exhibited statistical significance (P=0.006; P=0.009, respectively). Among the 130 patients of the UECT scan (59 males and 71 females; age range, 17–86 years old; mean, 52.26±11.08 years old) and the 168 patients for the CECT scan (72 men and 96 women; age range, 18–86 years old; mean, 52±11.29 years old), there was found to be no significant differences in age and gender between the high-risk and low-risk datasets (P=0.691; P=0.082 respectively).
Radiomics features selection
Through the Lasso algorithm method, each of the UECT and CECT scans extracted 12 features, which displayed significant differences in distinguishing high-risk lesions from the low-risk ones in the anterior mediastinum, as shown in Table 2. Then, LR classifier was built using 12 features selected from Lasso process (Figures 3,4).

Full table


Diagnostic performance of the radiomics model
The 12-feature model was trained with 8-fold and 3-fold cross-validation LR classifier in UECT and CECT respectively, with the ROC curve analysis results shown in Figure 5 for UECT and in Figure 6 for CECT. The AUC of the UECT training set was obtained as 0.842 (95% CI: 0.763–0.922; sensitivity 71.43%; specificity 74.07%); and the AUC of the UECT validation set was 0.774 (95% CI: 0.632–0.916; sensitivity 74.36%; specificity 72.73%). The AUC of the CECT training set and validation set were 0.741 (95% CI: 0.628–0.814; sensitivity 66.67%; specificity 64.81%), and 0.734 (95% CI: 0.597–0.872; sensitivity 62.96%; specificity 66.67%) respectively. This showed excellent predictive ability (Table 3).


Full table
Discussion
This study built predicted models for UECT and CECT scans using LASSO with LR as the feature selection and classifier over the normalized radiomics features. The two 12-feature radiomics models showed good performances in distinguishing high-risk lesions from the low-risks in the anterior mediastinum, and the UECT scan was proven to outperform CECT regarding the prediction for risk evaluation.
There are a variety of tumors in the anterior mediastinum (thymomas, thymic carcinomas, thymic carcinoids, lymphomas, germ cell tumors, lung metastases, etc.) or tumor-like lesions (intrathoracic goiter, thymic or bronchogenic cysts, lymphangiomas, aortic aneurysms, etc.) (3,17). Since surgical management differs for these conditions, it is essential to differentiate high-risk masses (including lymphomas, thymic carcinomas, WHO type B2, 3 thymomas and so on) from the low-risk ones (such as WHO types A, AB, B1 thymoma, thymic cysts, etc.) before treatment.
The invasive methods including biopsy, mediastinoscopy, and surgery are used in determining anterior mediastinum lesions routinely. Clinical follow-up is also a diagnostic way of determining anterior mediastinal lesions, but uncertain follow-up intervals may cause the widespread treatment delay of high-risk lesions. The radiomics method introduced in this study was found to be helpful for diagnosing high-risk lesions in a timely manner without follow-ups and in avoiding invasive examinations. Characteristics of routine CT scans, such as lesion margin, enhancement, and surrounding tissue invasion, can help evaluate the risks in anterior mediastinum lesions. This method is limited by the professional aptitude of radiologists and suffers from inter-reader variability. Based on the recent investigation by Kong et al., the value of the apparent diffusion coefficients (ADCs) is conducive to assessing the classification of thymic epithelial tumors (18). Although it eliminates subjective elements and acquires good diagnostic effects, MR is still not a routine examination and is not widely used in CT for anterior mediastinal lesions in clinical practice.
Some analyses have confirmed the distinguishing capability of the radiomic features for molecular subtypes and histologic grade in tumors, including gliomas (19), lung cancers (13), colorectal adenocarcinomas (20), bladder carcinomas (21), gastric cancer (22), prostate cancers (23), etc. In the glioma research (19), the AUC was between 0.922 and 0.975, and had an accuracy between 87.7% and 96.1% which was used to determine the histology and gradings of gliomas, providing a reliable alternative. Previous studies on anterior mediastinal masses are all based on QTA, which is a branch of radiomics category. In this study, both texture features and other categories of features were analyzed. In the two 12-feature radiomics models on UECT and CECT scans we obtained, 10 and 7 radiomics features, respectively, were from the texture feature group. When features of other categories were added, the predictions became more comprehensive. To increase the information content of extracted radiomics features, we delineated ROI along the lesion outline of every image, turning the ROIs into VOIs. Chaddad et al. (24) found that a 3D-wavelet transform could discriminate between colorectal cancer grades with the entropy feature, with higher accuracy and sensitivity than the two-dimensional (2D)-wavelet transform. The 3D analysis of whole lesions could be more representative of heterogeneity in tumors and offer a more complementary set of diagnostic information.
With no shape features in the 12-feature radiomics of UECT, one shape feature, shape-Spherical Disproportion, was selected from CECT, which might have been due to the enhancement scan highlighting the outline of the lesions. Since more texture features were selected from UECT than from CECT, the tumor heterogeneity was better detected in UECT, and the texture features from plain CT scan were found to be more significant in discriminating risk levels in anterior mediastinal lesions. In this study, high-risk lesions showed a larger size than low-risk ones, which was in line with the findings of Yanagawa et al.’s (25). Also, compared with CECT, UECT images showed higher accuracy, sensitivity, and specificity in distinguishing high-risk anterior mediastinal lesions. Since a large number of anterior mediastinal lesions were incidentally found on routine UECT, and hypersensitivity to iodinated contrast media was considered, it may be not necessary for CECT to perform further diagnosis.
Several limitations of this study are discussed as follows. First, two medical centers were enrolled, but the number of cases was still small. A multi-center collaboration is needed to enlarge the sample size for reducing sample selection bias and regional differences. Second, it is hard to control the sampling errors produced among different CT machines. In addition, the manual sketching method for the image was laborious, time-consuming, and subjective; thus, a more effective and precise way to outline the image should be explored in further investigation.
Conclusions
In conclusion, the CT radiomics model exhibited a strong correlation in differentiating high-risk lesions from low-risk lesions. This non-invasive method would be an economical way to perform early discrimination of high-risk anterior mediastinal lesions with an excellent diagnostic performance.
Acknowledgments
None.
Footnote
Conflicts of Interest: The authors have no conflicts of interest to declare.
Ethical Statement: This retrospective study received the approval from the Institutional Review Board (IRB number: 2019022607), and informed consent was obtained from all patients.
References
- Carter BW, Marom EM, Detterbeck FC. Approaching the patient with an anterior mediastinal mass: a guide for clinicians. J Thorac Oncol 2014;9:S102-9. [Crossref] [PubMed]
- Suster S, Moran CA. Histologic classification of thymoma: the World Health Organization and beyond. Hematol Oncol Clin North Am 2008;22:381-92. [Crossref] [PubMed]
- Marx A, Chan JK, Coindre JM, et al. The 2015 World Health Organization Classification of Tumors of the Thymus: Continuity and Changes. J Thorac Oncol 2015;10:1383-95. [Crossref] [PubMed]
- Chen G, Marx A, Chen WH, et al. New WHO histologic classification predicts prognosis of thymic epithelial tumors: a clinicopathologic study of 200 thymoma cases from China. Cancer 2002;95:420-9. [Crossref] [PubMed]
- Scorsetti M, Leo F, Trama A, et al. Thymoma and thymic carcinomas. Crit Rev Oncol Hematol 2016;99:332-50. [Crossref] [PubMed]
- Strobel P, Bauer A, Puppe B, et al. Tumor recurrence and survival in patients treated for thymomas and thymic squamous cell carcinomas: a retrospective analysis. J Clin Oncol 2004;22:1501-9. [Crossref] [PubMed]
- Abdel Razek AA, Khairy M, Nada N. Diffusion-weighted MR imaging in thymic epithelial tumors: correlation with World Health Organization classification and clinical staging. Radiology 2014;273:268-75. [Crossref] [PubMed]
- Scorsetti M, Leo F, Trama A, et al. Thymoma and thymic carcinomas. Crit Rev Oncol Hematol 2016;99:332-50. [Crossref] [PubMed]
- Carter BW, Okumura M, Detterbeck FC, et al. Approaching the patient with an anterior mediastinal mass: a guide for radiologists. J Thorac Oncol 2014;9:S110-8. [Crossref] [PubMed]
- Lambin P, Rios-Velazquez E, Leijenaar R, et al. Radiomics: extracting more information from medical images using advanced feature analysis. Eur J Cancer 2012;48:441-6. [Crossref] [PubMed]
- Kumar V, Gu Y, Basu S, et al. Radiomics: the process and the challenges. Magn Reson Imaging 2012;30:1234-48. [Crossref] [PubMed]
- Gillies RJ, Kinahan PE, Hricak H. Radiomics: Images Are More than Pictures, They Are Data. Radiology 2016;278:563-77. [Crossref] [PubMed]
- Song SH, Park H, Lee G, et al. Imaging Phenotyping Using Radiomics to Predict Micropapillary Pattern within Lung Adenocarcinoma. J Thorac Oncol 2017;12:624-32. [Crossref] [PubMed]
- Iannarelli A, Sacconi B, Tomei F, et al. Analysis of CT features and quantitative texture analysis in patients with thymic tumors: correlation with grading and staging. Radiol Med 2018;123:345-50. [Crossref] [PubMed]
- Yasaka K, Akai H, Abe O, et al. Quantitative computed tomography texture analyses for anterior mediastinal masses: Differentiation between solid masses and cysts. Eur J Radiol 2018;100:85-91. [Crossref] [PubMed]
- Yasaka K, Akai H, Nojima M, et al. Quantitative computed tomography texture analysis for estimating histological subtypes of thymic epithelial tumors. Eur J Radiol 2017;92:84-92. [Crossref] [PubMed]
- Strollo DC, Rosado de Christenson ML, Jett JR. Primary mediastinal tumors. Part 1: tumors of the anterior mediastinum. Chest 1997;112:511-22. [Crossref] [PubMed]
- Kong LY, Zhang W, Zhou Y, et al. Histogram analysis of apparent diffusion coefficient maps for assessing thymic epithelial tumours: correlation with world health organization classification and clinical staging. Br J Radiol 2018;91:20170580. [Crossref] [PubMed]
- Ditmer A, Zhang B, Shujaat T, et al. Diagnostic accuracy of MRI texture analysis for grading gliomas. J Neurooncol 2018;140:583-9. [Crossref] [PubMed]
- Huang X, Cheng Z, Huang Y, et al. CT-based Radiomics Signature to Discriminate High-grade From Low-grade Colorectal Adenocarcinoma. Acad Radiol 2018;25:1285-97. [Crossref] [PubMed]
- Xu X, Zhang X, Tian Q, et al. Quantitative Identification of Nonmuscle-Invasive and Muscle-Invasive Bladder Carcinomas: A Multiparametric MRI Radiomics Analysis. J Magn Reson Imaging 2019;49:1489-98. [Crossref] [PubMed]
- Tang L. Radiological evaluation of advanced gastric cancer: from image to big data radiomics. Zhonghua Wei Chang Wai Ke Za Zhi 2018;21:1106-12. [PubMed]
- Penzias G, Singanamalli A, Elliott R, et al. Identifying the morphologic basis for radiomic features in distinguishing different Gleason grades of prostate cancer on MRI: Preliminary findings. PLoS One 2018;13:e0200730. [Crossref] [PubMed]
- Chaddad A, Daniel P, Niazi T. Radiomics Evaluation of Histological Heterogeneity Using Multiscale Textures Derived From 3D Wavelet Transformation of Multispectral Images. Front Oncol 2018;8:96. [Crossref] [PubMed]
- Yanagawa M, Tomiyama N. Prediction of thymoma histology and stage by radiographic criteria. Thorac Surg Clin 2011;21:1-12. v. [Crossref] [PubMed]

