
Statistical modelling for thoracic surgery using a nomogram based on logistic regression
Introduction
A nomogram is a graphical representation designed to allow fast computation of a specific or complex function. It was invented by the French engineer Philbert Maurice d’Ocagne and has been widely used in electronic calculators, computers, and spreadsheets for many years. The simplest nomogram contains three parallel lines marked off to scale and arranged in such a way that by using a straightedge to connect known values on two lines, an unknown value or total value can be read at the point of intersection with the bottom line. As more advanced statistical methods are developed, more complicated nomograms have emerged, which consist of many lines and even curves in different forms with the application of Bayes’ theorem (1).
Over recent decades, a growing number of nomograms have been developed to predict clinical outcomes or the survival rates of different malignancies. After identifying relevant clinical and laboratory variables, mostly by multivariate logistic models (2) or Cox proportional-hazards regression (3), a clinically used nomogram is easy to develop using statistical software, which is a visual plot to display the relationship between variables and the outcome event. Once a nomogram has been built, it can easily be computerized when the predictive factors are inputted. Subsequently, the probability can be calculated automatically and may assist clinicians to access the necessity of further investigations or to predict the relevant outcomes.
However, the basic concepts of a nomogram remain unclear to clinicians, and occasionally some may even take it for a specific kind of statistical model or method. Actually, it is easy to construct a nomogram based on the results of multivariable regression. Nevertheless, developing a nomogram that has great clinical value is not easy.
In this paper, we illustrate the strategy of building a diagnostic nomogram with several clinically and statistically significant predictors via a multivariable logistic model, as well as the process used to assign points for each predictor, ultimately leading to the generation of total points or probability. Furthermore, validation strategies, including external or internal validation, calibration, discrimination, and key points in applying a nomogram are also highlighted.
Building strategy
Identifying a good clinical question
Theoretically, as long as the multivariable logistical model is clinically and statistically significant, the nomogram can be developed based on the statistical model. However, one must give first priority to the most valuable questions encountered in daily practice; e.g., predicting brain metastasis as the relapse in curatively resected non-small cell lung cancer (NSCLC) for the revision of the postoperative follow-up scheme (4) or predicting N2 involvement in T1 NSCLC that may influence the extent of lymphadenectomy (5). Therefore, identifying a good clinical topic is a vital step in the construction of the nomogram.
Building a regression model
Before constructing a real nomogram, a reliable regression model that can provide statistical evidence to support the selection of the predictors is necessary. Optimizing a reliable regression model includes the calculation of the sample size, data collection and preparation, model investigation, reduction of explanatory variables, and model optimization. Various regression models can be applied to data. At present, the most popular process for the selection of key predictors is multivariate analysis, in the form of logistic model or Cox proportional hazard model application. Sample size justification and multicollinearity assessment should be evaluated during the variable selection (6). However, readers are reminded that regression model construction is not the main focus of this paper, as this has been extensively covered previously (7).
If probability prediction regarding a binary clinical event is the main goal, then the multivariable logistic regression model could be the best choice. On the basis of the multivariable model, one can ultimately capture the most sophisticated information with the fewest number of variables that are believed to have a significant impact on the outcome.
Building a nomogram
Most of the articles about nomograms have focused on validation instead of the building process, and researchers can easily construct a nomogram using statistical software even without knowing the mechanisms. However, ignorance of the principle and the specific method of building a nomogram can limit, confuse, or even mislead its application. Bearing in mind the fundamental concept of a nomogram; it is a graphical version of the statistical model that reveals the relationship between predictors and outcome in proportional scale. In this section, we will show, step by step, how the four-covariate logistic model can be represented graphically to create a nomogram.
Through stepwise logistic regression, using the likelihood-ratio test by setting the statistical threshold at 0.05, Zhang and colleagues (5) developed a four-predictor logistic model (tumor size, central tumor location, invasive adenocarcinoma histology, and age) as follows, which can be used to estimate the probability of N2 disease in computed tomography–defined as T1N0 NSCLC.
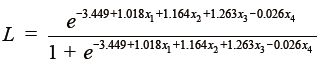
L: Likelihood of positive N2 nodes
x1: Tumor size
x2: Central tumor location
x3: Invasive adenocarcinoma histology
x4: Age
Table 1 shows the predictor age at diagnosis, tumor diameter, tumor location, histology, and the corresponding odds ratios according to Zhang et al. (5). The units for the diameter and age are cm and year, respectively. The location value is equal to 1 if the tumor is centrally located (location =0 if the tumor is peripherally located). Similarly, histology will be equal to 1 if the tumor is diagnosed as an invasive adenocarcinoma (histology =0 for other histologic types).

Full table
Generally, each predictor is assigned a point range from 0 to 100 where the biggest impact predictor (e.g., tumor size in Table 1) is identified as a reference; the others are then assigned based on their proportion to the biggest impact predictor. This is the principle of the point system in the nomogram. The detailed process is described below.
Identifying the biggest impact predictor by absolute maximum beta value
After extracting the useful information from an assumed reliable regression model, the absolute maximum beta value must be calculated, given that the units are different for the continuous (tumor size and age) and categorical predictors (central tumor location and invasive adenocarcinoma histology). In the above research, though with the smallest beta coefficient of 1.018, the calculated absolute maximum beta value (Beta × value range of the predictor) of the tumor size is 1.018×2.6=2.648, which means that it has the greatest impact on the probability of the event compared with the other three predictors (Table 1).
Assigning points to each predictor
The point system is then constructed by firstly assigning 100 points to the tumor size, which has the greatest impact; thus, 0 points are assigned to 0.4 cm and 100 points to 3 cm; other values are assigned to various tumor sizes based on linear interpolation.
Once the point system of the predictor with the greatest impact is set up, the remaining work is to assign other predictors in order, based on their proportion to the points assigned to the greatest impact predictor. Here we can take the central location as an example. The total points of the central location are assigned based on its proportion to the total points given to the tumor size.
Accordingly, 44 points are assigned if the tumor is centrally located; otherwise, 0 points are assigned if it is peripherally located. Usually, positive coefficients are required in nomograms to simplify the calculations. Given that the original beta value of age is negative, we assign 0 points to age =90 reversely, thus avoiding subtractions when generating the total score.
Calculate total points and refer to the probability scale
After assigning points to each predictor, we can sum up the total points of the four predictors and then project onto the probability scale from 0 to 1. Considering the concordance of the whole figure and manual measurement error, although the highest total points can only be up to 262 theoretically, the scale for total points in Figure 1 still ranges from 0 to 280. In addition, the range of predicted values in Figure 1 is from 0.1 to 0.8; however, this does not mean that the probability of N2 disease in T1N0 NSCLC for every single patient is ≥0.1 or ≤0.8. The interval can be regarded as a range for most patients. It would not be difficult to calculate that 0 points (age =90, diameter =0.4, location =0, histology =0) and 262 points (age =20, diameter =3, location =1, histology =1) correspond to a probability of 0.005 and 0.819 in the constructed logistic model, respectively. Finally, other values of probability are based on the total points that can be calculated by linear interpolation.

Additional example
Based on the nomogram shown in Figure 1, the following is presented as an example. The total points of a 65-year-old patient, who had a peripherally located invasive adenocarcinoma with a 2.0-cm diameter, can be approximately summed to 25+60+47+44=176. A perpendicular line drawn from the total points at 176 to the predicted value gives a probability between 0.3 and 0.4; this is close to the exact probability assigned by the multivariable logistical model.
Improving the nomogram
A nomogram can be developed using the guidelines outlined above. Evaluating the predictive model, which includes validation, discrimination, calibration, and sometimes, practical usefulness, should be given great importance. Again, given that the main purpose here is to illustrate the process of building a nomogram from a logistical model, we only introduce the basic evaluation process. There are several key steps used to assess nomogram performance, as given below.
Concept of validation
Nomogram validation refers to an evaluation of model performance in predicting the outcome response, using other samples for the purpose of reducing overfitting bias. It is important to remember that each predictive model, including the nomogram, is mathematically optimized to best-fit the data on which it was originally built. Hence, whether a nomogram can be used in practice will depend on whether it has good generalizability with other samples.
External validation, applying the nomogram to an independent sample, is preferred to examine model generalizability. A rule of thumb is to choose a comparable test set; however, this is not always easy. Alternatively, most studies tend to evaluate nomograms by internal validation, of which the bootstrapping method is one of the most reliable solutions (8). Bootstrapping is a nonparametric data generating method in which new sub-samples are generated repeatedly from the original data via repeated estimation of the statistics (stated later in this paper). For example, the nomogram was subjected to 1,000 bootstrap resamples for internal validation in the Zhang et al. study (5).
Calibration
Calibration measures the distance between the observed values of the response variables and the predicted event probabilities, which can be quantified by the Hosmer–Lemeshow test of goodness-of-fit (7). Calibration plots are usually utilized to vividly illustrate how predictions of the nomogram compare with actual probabilities for validation. Normally, the horizontal (X)-axis represents nomogram predictions, and the vertical (Y)-axis represents the observed rate of the outcome event in the validation cohort. The dashed 45° line represents the ideal performance of a nomogram, in which the predicted outcome corresponds perfectly to the actual performance. Concordance performance, either by presenting the bias-corrected calibration line or by separating into k-equal contiguous risk ranges (5), both by bootstrapping, can consequently be shown on the plot.
Discrimination
Discrimination refers to the ability to distinguish two classes of outcomes correctly. When we apply a built-up nomogram to the original sample, the probabilities of a clinical event can be summed up for each subject. With an adequate cut-off value set in advance, each subject is declared as either positive or negative. Here, what we are concerned about is whether the subjects are classified into the right or wrong event as they are observed, based on the nomogram.
C-index (concordance index) (9) and ROC (receiver operating characteristic) curve are the most frequently used statistical scales to quantify the discrimination for a nomogram (6). The ROC may be helpful in choosing a threshold, but would not be able to indicate algorithm performance. The C-index, usually regarded as a generalization of the area under the ROC curve, is a probability of concordance between the predicted and observed event, with c=0.5 for a random prediction and c=1 for a perfectly discriminating nomogram. Therefore, a C-index may be regarded as a measure of a situation such as ‘the probability that the algorithm is viable given a randomly selected threshold’. Note that the C-index is always higher in the training set; a bias-corrected C-index can be obtained through bootstrapping to demonstrate the extent of ‘overfitting’. Although it is revealed that the C-index is equivalent to the ROC curve area, they explain two sides of the nomogram.
Reviewing published nomograms
Interpreting the results from a nomogram can be tricky, as a single predictor with a higher number of points may not necessarily predict a real positive outcome. Additionally, a decision analysis curve that vividly presents the threshold interval deriving the net benefit could help in accessing the clinical usefulness of a nomogram-assisted decision (10). Iasonos et al. (11) outlined several points that should be reviewed before applying an existing nomogram to a new study cohort. Of importance, the discrimination and the calibration should be reported with confidence intervals. Meticulous assessment of these contents would enhance the value of nomogram-assisted decision making.
Conclusions
This article provides a brief overview of the theoretical guidelines for constructing a nomogram for thoracic surgery based on multivariate logistic regression, highlighting the fundamental concepts of the graphical interface through a step-by-step demonstration. In addition, it describes the common steps to follow when evaluating a nomogram. Essential elements to reviewing existing nomogram analyses are also mentioned. These guidelines are presented here with the hope of clarifying the process of nomogram development and evaluation in order to help clinicians and surgeons avoid common pitfalls in their analyses.
Recommended reading
- Iasonos A, Schrag D, Raj GV, et al. How to build and interpret a nomogram for cancer prognosis. J Clin Oncol 2008;26:1364-70. [Crossref] [PubMed]
- Balachandran VP, Gonen M, Smith JJ, et al. Nomograms in oncology: more than meets the eye. Lancet Oncol 2015;16:e173-80. [Crossref] [PubMed]
Acknowledgements
Permission to reprint the Figure 1 was obtained from the original publisher (Copyright Clearance Center, invoice paid No. RLNK501954145) and the corresponding author (Haiquan Chen). The authors would like to acknowledge Prof. Haiquan Chen for his help in sending the original image file for reuse.
Funding: This work was supported by CUHK direct grant (2015.1.087).
Footnote
Conflicts of Interest: The authors have no conflicts of interest to declare.
References
- Fagan TJ. Letter: Nomogram for Bayes theorem. N Engl J Med 1975;293:257. [Crossref] [PubMed]
- Yang XN, Zhao ZR, Zhong WZ, et al. A lobe-specific lymphadenectomy protocol for solitary pulmonary nodules in non-small cell lung cancer. Chin J Cancer Res 2015;27:538-44. [PubMed]
- Zhao ZR, Xi SY, Li W, et al. Prognostic impact of pattern-based grading system by the new IASLC/ATS/ERS classification in Asian patients with stage I lung adenocarcinoma. Lung Cancer 2015;90:604-9. [Crossref] [PubMed]
- Won YW, Joo J, Yun T, et al. A nomogram to predict brain metastasis as the first relapse in curatively resected non-small cell lung cancer patients. Lung Cancer 2015;88:201-7. [Crossref] [PubMed]
- Zhang Y, Sun Y, Xiang J, et al. A prediction model for N2 disease in T1 non-small cell lung cancer. J Thorac Cardiovasc Surg 2012;144:1360-4. [Crossref] [PubMed]
- Harrell FE Jr, Lee KL, Mark DB. Multivariable prognostic models: issues in developing models, evaluating assumptions and adequacy, and measuring and reducing errors. Stat Med 1996;15:361-87. [Crossref] [PubMed]
- Hosmer DW Jr, Lemeshow S, Sturdivant RX. Model-building strategies and methods for logistic regression. Applied Logistic Regression, Third Edition. Hoboken: John Wiley & Sons, Inc., 2000:89-151.
- Steyerberg EW, Harrell FE Jr, Borsboom GJ, et al. Internal validation of predictive models: efficiency of some procedures for logistic regression analysis. J Clin Epidemiol 2001;54:774-81. [Crossref] [PubMed]
- Pencina MJ, D'Agostino RB. Overall C as a measure of discrimination in survival analysis: model specific population value and confidence interval estimation. Stat Med 2004;23:2109-23. [Crossref] [PubMed]
- Vickers AJ, Elkin EB. Decision curve analysis: a novel method for evaluating prediction models. Med Decis Making 2006;26:565-74. [Crossref] [PubMed]
- Iasonos A, Schrag D, Raj GV, et al. How to build and interpret a nomogram for cancer prognosis. J Clin Oncol 2008;26:1364-70. [Crossref] [PubMed]

