
Dynamic and quantitative evaluation of degenerative mitral valve disease: a dedicated framework based on cardiac magnetic resonance imaging
Introduction
Degenerative mitral valve (MV) disease is a frequent disorder affecting around 2% of the population (1) and MV leaflet prolapse represents its most common finding, usually due to rupture of chordae tendineae and resulting in MV regurgitation (2). In particular, a progressive spectrum of degenerative MV disease is evident in the clinical practice, ranging from fibro-elastic deficiency (FED) to Barlow’s disease (BD) (3). The former generally involves prolapse of an isolated segment due to single chordal rupture in a normally shaped valve; the latter is associated with multi-segment prolapse due to multiple chordal rupture or elongation, significant excess of leaflet tissue and large annular size. According to the Carpentier’s functional classification (4), a precise localization of the pathology and the identification of concomitant MV lesions and abnormalities are crucial to elucidate the mechanism of MV dysfunction and manage the reconstructive surgical repair.
At this aim, three-dimensional (3D) real-time transesophageal echocardiography (RT-TEE) represents the gold standard to accurately characterize MV prolapse (5-8) and it is highly recommended for intraoperative guidance during surgical MV repair (9,10). In addition, cardiac magnetic resonance (CMR) imaging has progressively emerged as a valid noninvasively modality to evaluate the functional MV anatomy in normal and prolapsed scenarios (11-14). However, no specific recommendations or quantitative in vivo imaging predictors are currently available to objectively characterize the MV dysfunction and to systematically differentiate MV degenerative phenotypes, e.g., FED from BD (15).
For this purpose, in order to gain objective insight into MV degenerative alterations, we exploited a CMR-dedicated framework able to combine a standard radiological approach with a quantitative in vivo assessment of MV anatomy and function. The former consists of a rotational CMR sequence of acquisition, available on common CMR machines, to acquire the entire MV apparatus throughout the cardiac cycle; the latter, taking advantage of bioengineering methods, automatically computes the dynamic time course of several MV characteristics in order to investigate CMR-derived hallmarks associated to MV disease and identify phenotypic differences. Accordingly, the analysis was accomplished in patients referred to surgery for degenerative MV prolapse repair due to FED and BD, using a cohort of normal volunteers as a physiological term of comparison.
Methods
CMR imaging
At a single university hospital, CMR acquisitions were performed on 10 BD and 9 FED selected patients, undergoing repair for degenerative MV prolapse, and 10 control subjects who did not have any discernible MV pathology. Participants referred to surgery for MV prolapse repair but reporting contraindications to CMR imaging were excluded from the study. At the time of surgery, the surgical diagnosis of MV degenerative phenotype was classified as either BD or FED, according to standard clinical criteria (7,8,16). The Div. Cardiac Surgery Institutional Review Board approved the study and all the participants gave informed consent (MU 301390710 Rev. 02-03.07.14).
Each CMR acquisition was accomplished adopting a customized technique (17,18) carried out on a 3.0T TX Achieva (Philips Medical System, Irvine, California) machine: cine images were obtained through 18 long-axis planes, evenly rotated along the LV axis every 10 degrees with the LV axis of rotation defined as the segment connecting LV apex and MV centroid (Figure 1A). An isotropic pixel spacing of 1.25 mm and a slice thickness of 8 mm were adopted. Enabling the breath-holding modality, 30 cardiac phases were recorded on each plane, with different temporal resolution according to the characteristic R-R interval of each patient. For each acquisition, a set of 540 DICOM images were obtained, requiring a total acquisition time of about 10 minutes.

CMR images processing
Offline processing of CMR images was completely performed on a dedicated platform we developed in MATLAB (The MathWorks Inc., Natick, MA, United States) (17), including the segmentation of MV substructures on CMR images, the automatic 3D reconstruction of MV geometry and the quantitative analysis of the anatomical and functional key-aspects related to MV prolapse.
The procedure of CMR segmentation has already been exploited in previous works of the group for the numerical modeling of the MV patient-specific anatomy in order to deepen the mechanisms underlying MV prolapse and investigate the effects of different MV surgical repair techniques (18-20) or percutaneous approaches (21,22). Briefly, as reported in Figure 1B for a single frame of the R-R interval, two points (in red color) were manually selected on MV annulus in each of the acquired plane; the papillary muscles (PAPs), where visible, were added through a variable number of points (green points), selecting single points or defining a region of interest (ROI), i.e., selecting all the pixels inside it. In particular, MV segmentation was performed at six characteristic phases during the cardiac cycle: in early, mid, and late diastole (LD) and early, mid and late systole (LS). Specifically, early diastole (ED) was identified just after MV opening, LD as preceding MV closure, and mid diastole (MD) as midway between ED and LD. Early systole (ES) was identified as immediately after onset of MV closure, LS at or immediately before AV closure, and mid systole (MS) as midway between ES and LS (6,7). In addition, at MS, multiple points were selected on the MV leaflets profile on each tomographic CMR plane; for each leaflet, traced points were sampled in 32 points equally redistributed between the annulus and the free margin (Figure 1B).
The 3D coordinates of the points selected on each CMR cut-plane were reconstructed from the position of the latter with respect to the CMR rotation axis. At this purpose, further technical details can be found in the Supplementary file.
Subsequently, the geometry of MV annulus was automatically reconstructed (Figure 1C) through a two-step validated procedure (22). First, a cylindrical reference frame was set with the origin in the centroid (O) of the extracted cloud of annular points, and the z-axis normal to the least-square plane of the annular points defined. Second, in this local reference frame (Figure 1C), the radial (ρ) and axial (z) positions of the points belonging to the annular profile were approximated through a 4th order Fourier function of the angular position (ϑ). Finally, we identified four annular reference points (13): the saddle horn (SH), the midpoint of the posterior annulus (P2), the anterolateral (CAL) and the posteromedial (CPM) commissures. The 3D coordinates of both anterolateral (PAPAL) and posteromedial (PAPPM) PAPs tips were identified applying a K-means partitioning algorithm to separate the cloud of selected papillary points during segmentation in two mutually exclusive clusters, thus identifying the centroid of each PAP tip.
At MS, the surface of MV leaflets was automatically reconstructed through triangulation, i.e., Delaunay tessellation of leaflet profile points and displayed as a color-coded 3D-rendered surface to highlight the entity of MV bulging into the LA (Figure 1D)
Quantitative MV analysis
At the defined six cardiac phases, our platform automatically computed MV dimensions and relationships between MV sub-structures (Figure 2). Specifically, the following measurements were computed on each dataset:

- 2D annular area (A2D), i.e., the projection of the area included in MV annulus on the annular plane (Figure 2A);
- 3D annular area (A3D), as the area of 3D minimal surface analytically defined fit to the nonplanar annulus (Figure 2B);
- 3D annular perimeter (Pe, Figure 2C);
- maximum annular height (HMAX) defined as the maximal vertical (i.e., perpendicular to the annular fitting plane) distance between the highest and lowest annular points (Figure 2B);
- intercommissural (DCC) and anteroposterior (DAP) diameters (Figure 2C,D). The former was defined as the distance between the posteromedial (PM) and anterolateral (AL) horns of the annulus; the latter was computed as the length of segment connecting the SH with the middle posterior scallop (P2), passing through the annular centroid (O);
- eccentricity (e), defined as the intercommissural to anteroposterior diameter ratio (DCC/DAP);
- longitudinal displacement of the annular centroid (∆LO), with respect to its initial position at late diastole, along the axis perpendicular to the annular plane (Figure 2B);
- distance of the MV centroid O from the AL (DAL,O) and PM (DPM,O) PAPs tips, respectively (Figure 2E);
- distance between AL and PM PAPs tips (DPAPs) (Figure 2E);
- angle between PAPs (αPAPs) using the annular centroid O as the vertex of the angle (Figure 2F).
At MS, billowing volume (Vbillowing) and billowing height (Hbillowing) were added to the list of computed variables. We defined billowing of the leaflet (Figure 2G) as abnormal bowing of the leaflet toward the left atrium without involving the leaflet edge (23). With respect to the 3D nonplanar surface of the annulus (A3D), billowing volume was the volume included between the 3D nonplanar annular surface and the leaflets surface while billowing height represented the maximum height above this minimal surface (7).
Statistical analysis
All the statistical computations were performed in GraphPad Prism 7 (GraphPad Software Inc., La Jolla, CA, USA). Continuous variables were expressed as mean ± standard deviation (SD) and the normality of data distributions assessed through the Kolmogorov-Smirnov test. The comparison between group characteristics and overall static measurements, i.e., obtained by averages over the entire cardiac cycle, was accomplished through 1-way ANOVA and Post hoc analysis done by applying the Bonferroni test. The Chi-square test was adopted to compare categorical variables. Changes in dynamic CMR-derived variables were assessed using 2-way ANOVA for repeated measures with one factor analyzed as a repeated-measure factor. Statistical significance was indicated by a probability value of P<0.05.
Results
The characteristics of enrolled participants are summarized in Table 1: participants were predominantly men and FED subjects were generally older than BD subjects (P<0.05). From groups comparison, no significant differences were noticed in terms of body surface area (BSA, P=0.33), body mass index (BMI, P=0.795) and heart rate (P=0.106), as measured before CMR acquisition.

Full table
Overall MV characteristics
The overall MV characteristics, computed by averages over the six cardiac phases, are reported in Table 2 for both mitral annulus and PAPs, including the billowing height and billowing volume computed at MS. Multiple significant morphological differences were reported for annular dimensions, in particular between BD and Normal and between FED and BD, respectively. Annular areas (A2D and A3D) and perimeter (Pe) were significantly larger in BD than in FED (P<0.03) and Normal (P<0.001), while no significant differences were noticed between FED and Normal (P=0.24). If compared to Normal, BD phenotype reported the largest intercommissural (DCC, P<0.001) and anteroposterior (DAP, P<0.001) diameters with an average increase equal to +21.4% and +34.1%, respectively. In FED cohort, DCC and DAP dimensions were higher than in the Normal, although reporting a limited increase of +6.5% in DCC (P=0.55) and +14.5% in DAP (P=0.07). Accordingly, the MV eccentricity progressively decreased passing from Normal to FED (P=0.006 with respect to Normal) and BD (P=0.009 with respect to Normal), with the latter showing a rounder annulus shape than in both Normal and FED phenotypes.

Full table
Despite the computed morphological differences, both the FED and BD phenotypes reported an apically-oriented displacement of the annulus (∆LO) comparable to Normal (P=0.21): the average ∆LO, reported as negative since computed below the annular plane, was equal to −5.0±1.1 mm in Normal, −4.2±0.9 mm in FED (P=0.68 vs. Normal) and −5.4±1.0 mm in BD (P=0.91 vs. Normal), respectively. When considering the subvalvular apparatus, all the groups exhibited comparable DAL, O (P=0.64) and DPM, O (P=0.43) distances of the two PAPs tips from the annular centroid O as well as not significantly differences in the interpapillary distance (DPAPs, P=0.06) and angle (αPAPs, P=0.48).
Dynamic MV changes over the cardiac cycle
Dynamic changes in both MV annulus dimensions and PAPs positon over the cardiac cycle are reported in Figure 3 and Figure 4, respectively. For each computed variable, as detailed in Table 3 and Table 4, differences between groups as well as phasic changes within the same group were quantified.


Full table

Full table
As in Normal subjects, both phenotypes of MV prolapsed reported significant dynamic changes over the cardiac cycle (P Phase <0.001). Comparing the groups, significant differences were noticed in terms of annular dimensions (A2D, A3D, Pe, DCC and DAP, P Group ≤0.001), eccentricity (e, P<0.01) and height (HMax, P<0.03). In particular, during systole, Normal and FED reported a comparable transient early systolic contraction (Figure 3A-C) while in BD phenotype the contraction was followed by a higher degree of annular enlargement during mid and LS (P<0.001 vs. Normal), as clearly visible for A2D (Figure 3A, P Group × Phase <0.002), A3D (Figure 3B, P Group × Phase <0.004) and annular perimeter (Figure 3C, P Group × Phase <0.002). Differences in dynamic changes among the three groups were noticed also for DCC (Figure 3E, P Group × Phase =0.024) and DAP (Figure 3F, P Group × Phase =0.040) with the intercommissural diameter (Figure 3E) reporting in the BD phenotype a significant enlargement at MS and LS with respect to both FED (P<0.015) and Normal (P<0.001) subjects, exhibiting a comparable behaviour (P>0.05) in terms of DCC and DAP during systole. The annular eccentricity (Figure 3G) remained permanently higher in Normal compared to FED and BD phenotypes (P Group =0.008). In all the three groups, annular eccentricity progressively improved during diastole and reached the maximum value at ES, which was equal to 1.34±0.09 mm in Normal, 1.26±0.11 mm in FED (P>0.05 vs. Normal) and 1.21±0.11 mm in BD (P=0.03 vs. Normal), respectively. Within each group, HMax reported dynamic changes throughout the cardiac cycle (Figure 3D, P Phase <0.001).
The time course of the apically-oriented annular displacement (∆LO, Figure 3H) was superimposable for all the groups (P Group =0.231): taking LD as temporal reference for ∆LO computation, a dynamic pattern (P Phase <0.001) was visible over the cardiac cycle, reaching the highest excursion below the MV plane at LS: −10.6±2.1 mm, −9.5±2.2 mm and −10.8±3.4 mm in Normal, FED and BD, respectively.
The dynamic PAPs behavior (Table 4,Figure 4) was comparable in the three groups during both diastole and systole, with all the four variables reporting P Group >0.05 and P Phase <0.001. Indeed, the PAPs tips moved away from the MV centroid during diastolic LV filling while closing the gap on it during systole, with a comparable pattern of dynamic changes between the AL (Figure 4A) and the PM (Figure 4B) PAP. In the same way, both interpapillary distance (DPAPs, Figure 4C) and angle (αPAPs, Figure 4D) increased during diastole and decreased during systolic LV shrinking.
MV billowing
At MS, significant differences were found comparing the groups in terms of billowing height (P<0.001) and billowing volume (P<0.001) as reported in Table 2. Billowing height (Figure 5A) was almost negligible in Normal subjects while it ranged between 5.39±2.49 mm in FED (P<0.001 vs. Normal) and 7.76±2.41 mm in BD (P<0.001 vs. Normal). Billowing volume (Figure 5B) was an order of magnitude higher in BD than in FED (P=0.005) due to the larger extension of MV prolapsing surface, while a smaller though significant difference was noticed between FED and Normal (P<0.03). It is worth noting that the scatter plot (Figure 5C) created using the two variables as the horizontal (HBillowing) and the vertical (VBillowing) axis (8) facilitate the differentiation between Normal and MV prolapse phenotypes through HBillowing, and between FED and BD through VBillowing.

Discussion
In the present work we proposed a CMR-dedicated framework for the quantitative and clinical-friendly assessment of the dynamic changes in MV function over the cardiac cycle. For this purpose, the platform integrates radiological and bioengineering methods to provide an effective tool for the segmentation of CMR images, reconstruction of the MV apparatus and the quantification of relevant MV characteristics.
The results of this study clearly show that a CMR-driven MV analysis is feasible adopting a radial CMR sequence able to combine multiple long-axis planes. In particular, the proposed CMR analysis proved able to capture the physiological MV function as well as to pinpoint relevant differences in MV anatomy and dynamics when comparing FED and BD mitral prolapse phenotypes.
Although the gold-standard 3D RT-TEE capability to accurately assess MV apparatus and assist MV repair is beyond question (9,24,25), we herein underline the potential of CMR as a useful preoperative tool to investigate MV degenerative prolapse and guide surgeons in the identification of the concomitant mechanisms of MV dysfunction. For instance, applying TEE criteria to cine CMR images (11), we can identify MV prolapse within each prolapsing scallop and effectively use the criterion of 2 mm of MV leaflet excursion into the left atrium (i.e., Hbillowing >2 mm) to discriminate between normal and prolapsed MVs (Figure 5C).
Although several and reliable techniques for MV repair have spread out from the seminal Carpentier’s classification of MV dysfunction (3,4), no specific or quantitative recommendations are currently available for a systematic differentiation between FED and BD phenotypes (15). In this scenario, our results clearly support the hypothesis according to which FED and BD phenotypes are anatomically and functionally distinct (6,7,24) and these quantifiable differences may be exploited to help surgeons in gaining further insight into MV degenerative pathophysiology.
Overall MV annular dimensions (Table 2), consistently with previous findings (7,8,24), are markedly larger in BD than in Normal and FED while annular dimensions remain comparable between Normal and FED. Similarly, the significant degenerative changes in the annular shape (more circular in BD) and the annular height, which can elucidate the impact of MV degeneration on the 3D annular dynamics (26). Our quantification of systolic MV billowing well agrees with previous findings (8) showing the potential of both billowing height (Hbillowing, P<0.0001) and volume (Vbillowing, P<0.0001) to differentiate FED from BD patients (Figure 5C)
Over the cardiac cycle (Table 3), despite annular enlargement, FED and Normal annular kinematics are comparable but significantly differ from BD in particular during systole. Indeed, FED systolic annular behavior well resembles normal patterns of diametrical DCC and DPM expansion and progressive annular height increase between LD and MS (27). On the contrary, although maintaining a longitudinal and apically-oriented excursion comparable to FED and Normal (∆L, P Group × Phase =0.53), the BD annulus exhibits an early-to-late systolic abnormal enlargement (7), also beyond the annular diastolic dimensions, which may further contribute to leaflet separation and regurgitation during systole (6). Conversely, complementing the analysis with the quantification of the changes in PAPs dynamics over the cardiac cycle (Table 4), we notice that the PAPs dynamics can remain close to physiological conditions.
Hence, our analysis highlights annular alterations as the primary hallmark to identify severe MV degenerative prolapse, frequently associated with mitral annular disjunction (28); the unaltered behavior of MV sub-apparatus support the hypothesis of ventricular-annular decoupling (6).
In conclusion, our CMR-dedicated framework can be effective to gain insight into the characterization of degenerative phenotypes of MV prolapse, providing a quantitative assessment of the severity of MV dysfunction and potentially support the selection of the appropriate MV repair, according to the patient-specific clinical scenario. For instance, abnormal MV annular dynamics (e.g., excessive BD late-systolic annular enlargement) can be identified and referred to surgery to receive both repair for MV prolapse and adequate annuloplasty to remodel MV annulus (29); in prolapsing FED reporting a physiological-like dynamics, annuloplasty could be complementary during surgery as well as minimally-invasive MV repair, e.g., through a Mitraclip® (Abbott Vascular Inc., Menlo Park, California, US) or a Neochord® (NeoChord, Inc., Eden Prairie, Minnesota, US) system, could success without long-term relapse (30).
Furthermore, from a bioengineering standpoint, the proposed framework can be successfully coupled with the computational modelling of the patient-specific clinical scenario (31), taking the preoperative patient-specific MV dynamics into account, to virtually investigate both advantages and drawbacks of MV surgery (20) as well as the outcomes of a percutaneous intervention (21).
Acknowledgements
The authors would like to acknowledge Marco Vecchietto (Università degli Studi di Verona) for his valuable collaboration during CMR acquisitions; Andrea Zaccaria, Alessandra Riva and Stephane Piccolo (Politecnico di Milano) are acknowledged for their assistance during part of data processing.
Footnote
Conflicts of Interest: The authors have no conflicts of interest to declare.
Ethical Statement: The Div. Cardiac Surgery Institutional Review Board approved the study and all the participants gave informed consent (MU 301390710 Rev. 02-03.07.14).
Supplementary
Three dimensional CMR-dedicated procedure of MV reconstruction
Three dimensional (3D) coordinates Pi,3D, of the single point Pi selected during segmentation of rotational CMR images, are computed as:
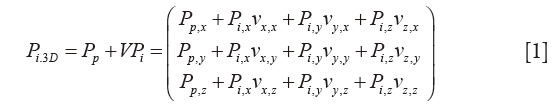
where the vector Pp (Pp,x; Pp,y; Pp,z) is the patient reference position of the plane in the global machine CMR system xyz, stored in the “ImagePositionPatient” DICOM field. Information stored in the “ImageOrientationPatient” DICOM field are included in V, containing the unit vectors vx (vx,x, vx,y, vx,z) and vy (vy,x, vy,y, vy,z) of each DICOM plane of sequence; subsequently, vz (vz,x, vz,y, vz,z) is obtained from the cross product vx × vy (Figure S1). On each cMRI image, point coordinates for Pi (Pi,x, Pi,y, Pi,z) are computed using the specific pixel dimension of the image (i.e., 1.25×1.25 mm), stored in the “Pixel spacing” DICOM field.

Subsequently, the geometry of MV annulus is automatically reconstructed through a two-step validated procedure (32,33): (I) a cylindrical reference frame is set with the origin in the center of mass of the MV annular extracted cloud of points, and the z-axis normal to the least-square plane of the annular points; (II) in this local reference frame, the radial (ρ) and axial (h) positions of the points belonging to the annular profile (Figure S1B, red line) are approximated through a 4th order Fourier function of the angular position (ϑ) in the form:
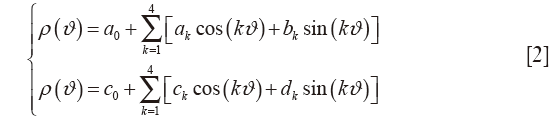
where a0, ak, bk, c0, ck and dk are the coefficients of the resulting Fourier function. Finally, annular characteristic landmarks are identified according to CMR morphological criteria (34). 3D coordinates of both anterolateral (PAPAL) and posteromedial (PAPPM) papillary muscles tips are identified applying a K-means partitioning algorithm to separate the selected papillary points during segmentation in two mutually exclusive clusters, thus identifying the centroid of each papillary muscle tip (33).
References
- Adams DH, Rosenhek R, Falk V. Degenerative mitral valve regurgitation: best practice revolution. Eur Heart J 2010;31:1958-66. [Crossref] [PubMed]
- Verma S, Mesana TG. Mitral-valve repair for mitral-valve prolapse. N Engl J Med 2009;361:2261-9. [Crossref] [PubMed]
- Adams DH, Anyanwu AC, Rahmanian PB, et al. Current concepts in mitral valve repair for degenerative disease. Heart Fail Rev 2006;11:241-57. [Crossref] [PubMed]
- Carpentier A. Cardiac valve surgery--the "French correction". J Thorac Cardiovasc Surg 1983;86:323-37. [PubMed]
- Pepi M, Tamborini G, Maltagliati A, et al. Head-to-head comparison of two- and three-dimensional transthoracic and transesophageal echocardiography in the localization of mitral valve prolapse. J Am Coll Cardiol 2006;48:2524-30. [Crossref] [PubMed]
- Grewal J, Suri R, Mankad S, et al. Mitral annular dynamics in myxomatous valve disease: new insights with real-time 3-dimensional echocardiography. Circulation 2010;121:1423-31. [Crossref] [PubMed]
- Clavel MA, Mantovani F, Malouf J, et al. Dynamic phenotypes of degenerative myxomatous mitral valve disease: quantitative 3-dimensional echocardiographic study. Circ Cardiovasc Imaging 2015.8. [PubMed]
- Chandra S, Salgo IS, Sugeng L, et al. Characterization of degenerative mitral valve disease using morphologic analysis of real-time three-dimensional echocardiographic images: objective insight into complexity and planning of mitral valve repair. Circ Cardiovasc Imaging 2011;4:24-32. [Crossref] [PubMed]
- Drake DH, Zimmerman KG, Hepner AM, et al. Echo-guided mitral repair. Circ Cardiovasc Imaging 2014;7:132-41. [Crossref] [PubMed]
- Adams DH, Anyanwu AC, Sugeng L, et al. Degenerative mitral valve regurgitation: surgical echocardiography. Curr Cardiol Rep 2008;10:226-32. [Crossref] [PubMed]
- Han Y, Peters DC, Salton CJ, et al. Cardiovascular magnetic resonance characterization of mitral valve prolapse. JACC Cardiovasc Imaging 2008;1:294-303. [Crossref] [PubMed]
- Delling FN, Kang LL, Yeon SB, et al. CMR predictors of mitral regurgitation in mitral valve prolapse. JACC Cardiovasc Imaging 2010;3:1037-45. [Crossref] [PubMed]
- Maffessanti F, Gripari P, Pontone G, et al. Three-dimensional dynamic assessment of tricuspid and mitral annuli using cardiovascular magnetic resonance. Eur Heart J Cardiovasc Imaging 2013;14:986-95. [Crossref] [PubMed]
- Cawley PJ, Maki JH, Otto CM. Cardiovascular magnetic resonance imaging for valvular heart disease: technique and validation. Circulation 2009;119:468-78. [Crossref] [PubMed]
- Nishimura RA, Otto CM, Bonow RO, et al. 2014 AHA/ACC guideline for the management of patients with valvular heart disease: a report of the American College of Cardiology/American Heart Association Task Force on Practice Guidelines. J Thorac Cardiovasc Surg 2014;148:e1-e132. [Crossref] [PubMed]
- Anyanwu AC, Adams DH. Etiologic classification of degenerative mitral valve disease: Barlow's disease and fibroelastic deficiency. Semin Thorac Cardiovasc Surg 2007;19:90-6. [Crossref] [PubMed]
- Sturla F, Onorati F, Votta E, et al. Repair of Mitral Valve Prolapse Through ePTFE Neochordae: A Finite Element Approach From CMR. In: Lenarz T, Wriggers P, editors. Biomedical Technology. Lecture Notes in Applied and Computational Mechanics: Springer International Publishing; 2015:117-28.
- Stevanella M, Maffessanti F, Conti C, et al. Mitral Valve Patient-Specific Finite Element Modeling from Cardiac MRI: Application to an Annuloplasty Procedure. Cardiovasc Eng Technol 2011;2:66-76. [Crossref]
- Sturla F, Onorati F, Votta E, et al. Is it possible to assess the best mitral valve repair in the individual patient? Preliminary results of a finite element study from magnetic resonance imaging data. J Thorac Cardiovasc Surg 2014;148:1025-34; discussion 34. [Crossref] [PubMed]
- Sturla F, Votta E, Onorati F, et al. Biomechanical drawbacks of different techniques of mitral neochordal implantation: When an apparently optimal repair can fail. J Thorac Cardiovasc Surg 2015;150:1303-12.e4. [Crossref] [PubMed]
- Sturla F, Vismara R, Jaworek M, et al. In vitro and in silico approaches to quantify the effects of the Mitraclip(R) system on mitral valve function. J Biomech 2017;50:83-92. [Crossref] [PubMed]
- Sturla F, Redaelli A, Puppini G, et al. Functional and Biomechanical Effects of the Edge-to-Edge Repair in the Setting of Mitral Regurgitation: Consolidated Knowledge and Novel Tools to Gain Insight into Its Percutaneous Implementation. Cardiovasc Eng Technol 2015;6:117-40. [Crossref] [PubMed]
- Lee AP, Hsiung MC, Salgo IS, et al. Quantitative analysis of mitral valve morphology in mitral valve prolapse with real-time 3-dimensional echocardiography: importance of annular saddle shape in the pathogenesis of mitral regurgitation. Circulation 2013;127:832-41. [Crossref] [PubMed]
- Maffessanti F, Marsan NA, Tamborini G, et al. Quantitative analysis of mitral valve apparatus in mitral valve prolapse before and after annuloplasty: a three-dimensional intraoperative transesophageal study. J Am Soc Echocardiogr 2011;24:405-13. [Crossref] [PubMed]
- Tsang W, Freed BH, Lang RM. The role of 3-dimensional echocardiography in the diagnosis and management of mitral valve disease: myxomatous valve disease. Cardiol Clin 2013;31:203-15. [Crossref] [PubMed]
- Caiani EG, Fusini L, Veronesi F, et al. Quantification of mitral annulus dynamic morphology in patients with mitral valve prolapse undergoing repair and annuloplasty during a 6-month follow-up. Eur J Echocardiogr 2011;12:375-83. [Crossref] [PubMed]
- Veronesi F, Corsi C, Sugeng L, et al. A study of functional anatomy of aortic-mitral valve coupling using 3D matrix transesophageal echocardiography. Circ Cardiovasc Imaging 2009;2:24-31. [Crossref] [PubMed]
- Eriksson MJ, Bitkover CY, Omran AS, et al. Mitral annular disjunction in advanced myxomatous mitral valve disease: echocardiographic detection and surgical correction. J Am Soc Echocardiogr 2005;18:1014-22. [Crossref] [PubMed]
- Adams DH, Anyanwu AC, Rahmanian PB, et al. Large annuloplasty rings facilitate mitral valve repair in Barlow's disease. Ann Thorac Surg 2006;82:2096-100; discussion 2101. [Crossref] [PubMed]
- Feldman T, Young A. Percutaneous approaches to valve repair for mitral regurgitation. J Am Coll Cardiol 2014;63:2057-68. [Crossref] [PubMed]
- Votta E, Le TB, Stevanella M, et al. Toward patient-specific simulations of cardiac valves: state-of-the-art and future directions. J Biomech 2013;46:217-28. [Crossref] [PubMed]
- Sturla F, Redaelli A, Puppini G, et al. Functional and Biomechanical Effects of the Edge-to-Edge Repair in the Setting of Mitral Regurgitation: Consolidated Knowledge and Novel Tools to Gain Insight into Its Percutaneous Implementation. Cardiovasc Eng Technol 2015;6:117-40. [Crossref] [PubMed]
- Stevanella M, Maffessanti F, Conti C, et al. Mitral Valve Patient-Specific Finite Element Modeling from Cardiac MRI: Application to an Annuloplasty Procedure. Cardiovasc Eng Technol 2011;2:66-76. [Crossref]
- Maffessanti F, Gripari P, Pontone G, et al. Three-dimensional dynamic assessment of tricuspid and mitral annuli using cardiovascular magnetic resonance. Eur Heart J Cardiovasc Imaging 2013;14:986-95. [Crossref] [PubMed]

