
Oxygenator performance and artificial-native lung interaction
Introduction
While its use is largely increasing, extracorporeal membrane oxygenation (ECMO) management has considerably changed based on research findings and technological progress (1), with increasing and remarkable short (2) and long-term (3,4) survival rates.
In veno-venous ECMO (VV ECMO) configuration, oxygen (O2) transfer and carbon dioxide (CO2) removal are provided by a membrane lung (ML), with its blood pump, placed in series with the failing native lung (NL). Therefore, the patient’s lung physiologic gas exchange function can be totally or partially substituted by an artificial one.
During VV ECMO, the total amount of O2 delivery and the total CO2 removal cannot simply only rely on a two-dimensional relationship between NL ventilation and the patient’s metabolic-hemodynamic pattern. A three-dimensional approach is then required, taking extracorporeal oxygenator gas exchange also into account. Therefore ML, NL and metabolic status should be analysed separately, in order to better understand their interaction and to correctly manage the patient-ECMO system.
Monitoring ML function and comparing it with the patient NL status are then important to understand the ECMO system performance level, in order to identify and correctly treat blood gas abnormalities and guiding the weaning procedure. Since ML failure is the second most common mechanical complication (5), its monitoring is crucial in order to recognise the right timing for ML replacement. ML gas exchange data are usually obtained by blood samplings from the ECMO circuit, for gas analysis, combined with simultaneous extracorporeal system measurement, during periodical ECMO system checks. Even if scheduled to prevent or detect problems that might arise during the treatment, these non-continuous assessments, however, may fail timely detection of critical issues. Considering the severity of the underlying disease and all of the risks connected with extracorporeal circulation, a continuous monitoring of ECMO systems might be an important step forward, by improving safety and adding relevant clinical information.
The present article deals with the clinical impact of an ECMO circuit monitoring system. The continuous examination of a set of critical parameters could represent an innovative way to monitor ML performance and the complex interaction with NL, together with important clinical inferences.
ML physiology and pathology
The oxygenator plays a central role during VV ECMO, replacing patient pulmonary alveolar function, as its main functions are to transfer O2 to the blood (V’O2ML) and to remove CO2 (V’CO2ML).
Non-microporous polymethylpentene hollow-fiber membranes are today mainly used for long-term ECMO application so that gas exchange is guaranteed, in a physiological way, by the partial pressure gradient on both sides of a diffusion membrane, without any direct gas-blood interface. Despite working in a similar way, NL and ML are different in terms of exchange surface area and membrane thickness (Table 1), thus limiting the maximal V’O2ML to 350 mL/min compared to the NL O2 transfer (V’O2NL), which could reach 2,500 mL/min during exercise (6).

Full table
Even from a pathological point of view, ML could be assimilated to a NL: according to Riley’s three-compartment lung model (7), the oxygenator can be imagined as divided into functional units, characterized by different ventilation/perfusion (VA/Q) ratios (8). The ideal situation is represented by the absence of any coupling alterations between ventilation and perfusion (VA/Q =~1). Despite introduction of tip-to-tip antithrombotic surface coatings, the non-biologic surface of an extracorporeal circuit leads to a systemic inflammatory response, triggering the activation and consumption of pro- and anti-coagulant blood components (9), with thrombotic, fibrin or cellular deposits on hollow-fibers that worsen gas exchange performance (10). Extensive clot formation around fibers determines a ventilated but not perfused compartment, with a “dead space effect” (VA/Q =∞), while pseudomembranous deposits on fiber walls may completely impede gas exchange, causing a “shunt effect” (VA/Q =0).
ML oxygen transfer
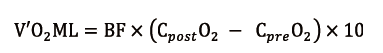
V’O2ML (mL/min) is proportional to blood flow (BF, L/min) and the difference in O2 content between blood coming out (CpostO2, mL/dL) and entering (CpreO2, mL/dL) the ML. It can be calculated as follows (8):
Since blood content in O2 (CaO2) could be calculated as follows:
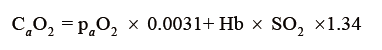
it is easy to understand that haemoglobin concentration (Hb, g/dL) and its O2 saturation (SO2, %) are of paramount importance in the amount of O2 carried by blood, while O2 blood partial pressure (paO2, mmHg) has a negligible role, represented by a very low (0.0031) solubility coefficient.
These formulas are representative of the several factors that are implied in the patient’s oxygenation during VV ECMO support. Firstly, BF and ML gas inlet O2 fraction ratio (FiO2ML) are crucial for blood oxygenation (11,12). The latter determines sweep gas O2 partial pressure, which generates the O2 pressure gradient that drives O2 transfer. VV ECMO performance can be negatively affected by recirculation (13), caused by a fraction of oxygenated blood delivered by the infusing cannula withdrawn by the draining cannula, before entering the systemic circulation. Nonetheless the oxygenation power depends by ML intrinsic properties (surface area, hollow fiber thickness and composition) and ML performance, influenced by inlet blood venous saturation (14) and the age of the oxygenator itself.
Considering extracorporeal BF, it is obvious that only the portion coupled with ventilation is significant for blood oxygenation. Hence the importance of ML shunt fraction (Qs/QBF) for O2 transfer efficiency: the higher the shunt ratio, the lower the V’O2ML. New ML have a negligible shunt ratio, theoretically lower than 10% (15), expected to increase because of ML aging process, as debris and fibrin coat the capillaries in which the blood flows, thus hindering the passage of O2.
ML shunt can be calculated as follows (16):
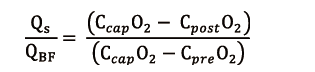
where CcapO2 is to be considered as the ML capillary (ideal) O2 concentration. It could be calculated with the O2 blood content formula:
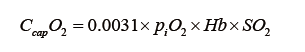
using 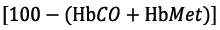 for SO2 and
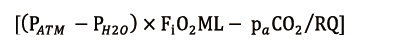
as piO2. In the previous formulas HbCO is Hb saturated in carbon monoxide, HbMet is methemoglobin, piO2 is oxygen partial pressure at ML gas inlet, PATM is atmospheric pressure, PH2O is steam partial pressure, paCO2 is blood CO2 partial pressure and RQ is the respiratory quotient.
Though interesting in a speculative way, it is not surprising that shunt ratio is not widely used, as a trouble shouting parameter due to its cumbersome calculation. ML oxygenation performance is therefore commonly evaluated by ML P/F ratio (mmHg), calculated as O2 partial pressure at ML blood outlet (ppostO2, mmHg) to FiO2ML (ratio). ML P/F and Qs/QBF ratios are therefore inversely proportional (Figure 1).

Even if ML P/F ratio is clearly a much more “user friendly” parameter, it has been demonstrated that the ML shunt only correlates significantly with its performance (17) and aging process. In fact, an abrupt and significant drop of ML P/F could occur without any evidence of ML impairment, for example with a low inlet blood O2 saturation, in case of high metabolic demand (16).
ML carbon dioxide removal
VV ECMO has an enormous capacity to remove CO2 from patient’s blood. The ML gas flow (GF) is the major determinant of ML CO2 removal (V’CO2ML), which is relatively independent from BF (18). The increase of GF reduces the CO2 partial pressure at ML sweep gas outlet (peCO2), increasing the partial pressure gradient in between blood and gas phase and consequently augmenting V’CO2ML.
V’CO2ML (mL/min) can be easily calculated (19) from the ML GF (mL/min) and the CO2 concentration at ML sweep gases outlet ([CO2]e, ratio), measured with an infrared analyser, as follows:
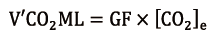
The infrared capnometer sampler must not impose great resistance in order to avoid pressure increase in the ML. A correct measurement can be obtained after at least 30 seconds of purge with high GF (10 L/min) in order to get rid of excessive moisture, as condensation and water vapour when trapped into hollow-fibers reduce ML decarboxylation capacity (20).
V’CO2ML power is directly proportional to GF, as in the NL CO2 elimination (V’CO2NL), which is proportional to alveolar ventilation. Ventilated but not perfused ML sections, as it can occur when hollow-fibers are completely clogged with thrombi, do not participate to decarboxylation, generating the so-called ML dead space (VdsML, ratio). It can be calculated as follows (8):
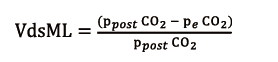
obtained from CO2 partial pressure at the ML blood outlet (ppostCO2, mmHg) and peCO2, (mmHg), also measured with an infrared CO2 analyser at sweep gas outlet.
Therefore, VdsML negatively influences V’CO2ML and it is compensated in clinical practice by a progressive increase of GF, in order to maintain a normal patient paCO2.
Gas exchange partitioning
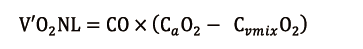
In VV ECMO configuration, since the extracorporeal ML is positioned in series to the patient’s NL, the blood returning to the right heart (mixed venous blood), with its O2 content (CvmixO2), is an admixture of the deoxygenated venous return and the well-oxygenated extracorporeal blood (8).
Depending on its residual function, the NL then adds an amount of O2 (V’O2NL), directly proportional to cardiac output (CO), calculated as follows:
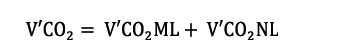
The final arterial CaO2 is afterwards the result of the total amount of O2 transfer (V’O2), partitioned into V’O2ML and V’O2NL:
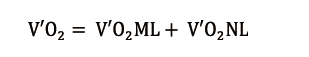
In a similar way, the total amount of CO2 removal (V’CO2) from the patient’s blood could be partitioned into V’CO2ML and V’CO2NL:
Once in the pulmonary capillaries, CO2 readily diffuses to the alveolar space, passing through the alveolar-capillary membrane in an extremely efficient way, that CO2 alveolar partial pressure (pACO2) usually can be considered to be equal to that of the pulmonary end-capillary blood. Hence, pACO2 is the main important determinant of V’CO2NL. Alveolar ventilation is then fundamental to compensate the continuous CO2 supplement to alveolar gas from pulmonary circulation, by reducing pACO2.
NL and ML gas exchange monitoring
During VV ECMO there is cooperation between the ML and the NL in gas exchange since these two systems work in-series. How V’O2 and V’CO2 are shared differently, depends on ML and NL functional states and ECMO and mechanical ventilation settings.
In order to evaluate all these data in their complexity, most centres use homemade electronic data sheets to collect raw data and calculate derived parameters of extreme importance, even though these informations are not continuous or calculated in real-time. Collecting these data can be cumbersome and time consuming. It is nonetheless important for a clear trend perception of ML performance and an estimation of the NL conditions and recovery. By this way it is possible to calculate ML Qs/QBF and VdsML, at least daily or whenever clinical trends dictate the need for an accurate gas exchange assessment.
Many ECMO centres are investigating different ways for a real-time continuous system of monitoring. In our intensive care unit (ICU) of a tertiary university hospital, we use a monitoring system originally designed for short-term applications on heart-lung machines, in order to guide the medical team in making decisions about cardiopulmonary bypass management. It provides information about O2 transport and consumption, venous and arterial oxygenation, as well as extracorporeal circuit pressures and BF, with a capability to update data every 5 seconds and show their trends continuously. For its use it is necessary to make two cuts in the drainage and the reinfusion lines, in order to insert two specific 3/8’’ adapters for the probes (Figure 2A). Probe A, denoted as the venous probe, provides Hb concentration, pre-oxygenator (venous) Hb O2 saturation (SvO2) and temperature (Tven) measurements. Probe B, denoted as the arterial probe, provides the measurement of post-oxygenator (arterial) Hb O2 saturation (SaO2) and temperature (Tart). An ultrasound flow meter provides the measurement of extracorporeal BF (Figure 2B). The monitor also manages three pressure transducers, connected to the ECMO circuit ports: pre-pump (drainage pressure), pre-ML (pre-oxygenator pressure) and post-ML (post-oxygenator pressure).

It calculates several derived parameters from measured values, and among them V’O2ML maintains validity during VV ECMO. It is calculated according to the following simplified equation (21):
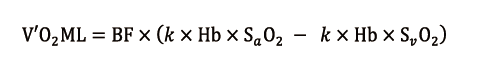
using a coefficient (k = 13.8), for V’O2ML expressed as mL/min, Hb as g/dl and BF as L/min.
The V’O2NL measurement is performed rarely, because it requires a pulmonary artery catheter, not commonly used in our ICU, except for particular selected cases.
Besides these continuous measurements, we also perform measurements of the decarboxylation function of the NL and ML. V’CO2NL is obtained by the volumetric capnometry function integrated into our mechanical ventilator. V’CO2ML is calculated at least on a daily basis by volumetric capnometry, applied to the ML, with an infrared CO2 analyser at the sweep gas outlet (Figure 3).

The measured values are reliable and reasonably accurate, but obviously the system has some limits. First of all, it represents an adjunct to our daily ECMO analysis, but it cannot substitute it completely. Blood samples must be obtained daily also to calibrate the machine and we have to refer to blood samples every time we consider that the values have changed or the clinical situation does not reflect what we see on the screen. The system aims in casting some light between daily (or one-per-shift) analysis, in order to avoid dramatic and unforeseen changes, which would need to be dealt with in a well-timed manner.
The system we are using is focused on ML oxygenation function only. However, we are now introducing in our clinical practice a new non-invasive diagnostic monitoring system, with a gas measurement module (Figure 4A) and a gas outlet CO2 sensor, which allows for continuous V’CO2ML measurement (Figure 4B).

Monitoring both ML oxygenation and decarboxylation function could be helpful as these two sometimes do not fail at the same time. Moreover, analysis of both V’O2ML and V’CO2ML could be useful to estimate the NL gas exchange residual function in ML-NL interaction.
ML gas exchange monitoring in clinical practice
In a clinical case, we described how it was possible to monitor V’CO2 partitioning between the NL and the ML, during ECMO weaning (22). It was useful to determine the progressive improvement of lung conditions, demonstrated by an increase of V’CO2NL. It was possible at the same time to reduce ML GF, hence V’CO2ML, and therefore finally removing the extracorporeal support.
The ML aging process could be defined as the progressive decay of ML gas transfer. V’O2ML and V’CO2ML have to be considered and checked separately as they may not always decay at the same time: ML performance could decrease because of the failure of one function, while the other is still more than efficient. It is possible to find different results in literature regarding the oxygenator half-life and its decay of efficacy. Lehle et al. observed a reduction in CO2 elimination during the first 5 days of ECMO use, without any change in O2 transfer (23). In a previous article, the same author described the requirement of ML replacements after a mean interval of 11±7 days in 3 out of 31 patients (10). In a retrospective study Lubnow et al. described ECMO substitution due to ML failure, between 6 and 12 days of use in 28 out of 83 patients (24), while Panigada et al., in a total of 22 patients, with a median ECMO duration of 8 [6–13] days, observed the worsening of oxygenator performance in 7 (26%) patients (17).
Our group is carrying out pilot-studies founded on a new manner to evaluate ML functional decline, based on V’CO2ML monitoring: every measured V’CO2ML could be correlated to a testing workbench V’CO2ML theoretic value, at the same GF/BF ratio, obtaining the so-called V’CO2ML ratio (Figure 5A,B).

In a former preliminary abstract (25) we demonstrated a statistically significant decrease of ML measured/theoretical V’CO2 ratio between the first and last day of use of 7 different MLs. We observed that mean V’CO2ML ratio decreased from 0.97±0.17 to 0.75±0.17 (P=0.0121), while mean ML dead space (VdsML) increased from 0.24±0.07 to 0.47±0.09 (P=0.0005) (Figure 6). It could be explained by clot apposition on ML fibers, with the formation of ventilated but not perfused units, showed by the concurrent increase in VdsML (Figure 7). Even if further investigations are needed to confirm their value, CO2 removal based indexes could represent useful additional early predictors of ML deterioration.


A monitoring system could be useful in daily clinical practice to evaluate oxygenator replacement timing by assessing ML efficiency, especially when it is running beyond its certification period. In a previous clinical case (21), we showed how V’O2ML was useful to monitor oxygenator performance beyond the 15-day ML certification period, up to day 37.
A V’O2ML acceptable for the metabolic demand of the patient has been maintained, with no substantial decline of ML performance, with an important contribution that might have come from a meticulous control of coagulation. Therefore, we underline the importance of laboratory monitoring, such as C-reactive protein, procalcitonin, haptoglobin, free blood Hb, D-dimer and coagulation tests, in order to get a perspective of inflammatory, haemolytic and thrombotic phenomena, triggered by the extracorporeal circuit.
D-dimer especially has been proposed as a good parameter of ML aging. It cannot be overlooked, as increased levels of plasma D-dimer could reveal clot apposition on ML fibers (26) and its deterioration (27). In another preliminary study, based on V’CO2ML ratio, we have seen how the increased D-dimer levels could correlate significantly to decreased V’CO2ML ratio and increased VdsML (28) (Figure 8). Therefore, these parameters might represent early predictors of ML performance decline, to guide ML replacement decision-making.

Rigorous and constant monitoring and check of ECMO systems with a proper management could then help to keep ML gas transfer power stable (29), even during long-run ECMO support.
Moreover, it is important to note that the ML aging process showed by monitoring data is not the only element to make correct decisions about ML substitution and ECMO management. In fact, it is important to take into account the entire global clinical setting during extracorporeal assistance. Therefore, even if ML gas transfer deterioration could suggest an ongoing aging process, ML substitution could be postponed if it is sufficient for the patient’s actual needs. It is fundamental to remember that the oxygenator change procedure is a life-threatening situation (30), also related to dangerous complications, such as hypoxia, heart rate alterations, cardiac arrest and embolic events. Then, if possible, a conservative attitude allows clinicians to protect the patient, globally reducing the cost of assistance.
Conclusions
Accurate ML gas transfer monitoring and simultaneous NL state evaluation represent an important adjunct in ECMO management, along with pressure drops measurement across the ECMO circuit and daily sampling for haemolysis and coagulation laboratory tests. They are all crucial to improve the safety of the technique with a more timely and precise analysis of ECMO performance, avoiding unforeseen abrupt ECMO failure. Additionally, an accurate analysis of NL status is fundamental to avoid complications both from ECMO and from the ventilator and to make decisions in the clinical setting, with a multi-dimensional approach.
In conclusion, ECMO real-time monitoring systems could allow a wide-ranging understanding of the complex patient-ECMO system and its appropriate clinical management. Further studies are necessary in order to improve and complete all the monitored parameters, increasing their accuracy and regulating their clinical use, in order to make them a gold standard for ECMO management.
Acknowledgements
None.
Footnote
Conflicts of Interest: M Belliato received fees as congress speaker and for consultancies from Eurosetes srl (Medolla, Italy), Maquet Cardiopulmonary GmbH (Rastatt, Baden-Württemberg, Germany), Hamilton Medical (Bonaduz, CH); F Epis has no conflicts of interest to declare.
References
- Bartlett RH, Deatrick KB. Current and future status of extracorporeal life support for respiratory failure in adults. Curr Opin Crit Care 2016;22:80-5. [Crossref] [PubMed]
- Thiagarajan RR, Barbaro RP, Rycus PT, et al. ELSO member centers. Extracorporeal Life Support Organization Registry International Report 2016. ASAIO J 2017;63:60-7. [Crossref] [PubMed]
- von Bahr V, Hultman J, Eksborg S, et al. Long-Term Survival in Adults Treated With Extracorporeal Membrane Oxygenation for Respiratory Failure and Sepsis. Crit Care Med 2017;45:164-70. [Crossref] [PubMed]
- von Bahr V, Hultman J, Eksborg S, et al. Long-Term Survival and Causes of Late Death in Children Treated With Extracorporeal Membrane Oxygenation. Pediatr Crit Care Med 2017;18:272-80. [Crossref] [PubMed]
- Allen S, Holena D, McCunn M, et al. A review of the fundamental principles and evidence base in the use of extracorporeal membrane oxygenation (ECMO) in critically ill adult patients. J Intensive Care Med 2011;26:13-26. [Crossref] [PubMed]
- Chauhan S, Subin S. Extracorporeal membrane oxygenation, an anesthesiologist's perspective: physiology and principles. Part 1. Ann Card Anaesth 2011;14:218-29. [Crossref] [PubMed]
- Riley RL, Cournand A. Ideal alveolar air and the analysis of ventilation perfusion relationships in the lungs. J Appl Physiol 1949;1:825-47. [Crossref] [PubMed]
- Scaravilli V, Zanella A, Sangalli F, et al. Basic Aspects of Physiology During ECMO Support. In: Sangalli F, Patroniti N, Pesenti A. editors. ECMO-Extracorporeal Life Support in Adults. Milan: Springer, 2014:19-36.
- Oliver WC. Anticoagulation and coagulation management for ECMO. Semin Cardiothorac Vasc Anesth 2009;13:154-75. [Crossref] [PubMed]
- Lehle K, Philipp A, Gleich O, et al. Efficiency in extracorporeal membrane oxygenation-cellular deposits on polymethylpentene membranes increase resistance to blood flow and reduce gas exchange capacity. ASAIO J 2008;54:612-7. [Crossref] [PubMed]
- Schmidt M, Tachon G, Devilliers C, et al. Blood oxygenation and decarboxylation determinants during venovenous ECMO for respiratory failure in adults. Intensive Care Med 2013;39:838-46. [Crossref] [PubMed]
- Park M, Costa EL, Maciel AT, et al. Determinants of oxygen and carbon dioxide transfer during extracorporeal membrane oxygenation in an experimental model of multiple organ dysfunction syndrome. PLoS One 2013;8:e54954. [Crossref] [PubMed]
- Xie A, Yan TD, Forrest P. Recirculation in venovenous extracorporeal membrane oxygenation. J Crit Care 2016;36:107-10. [Crossref] [PubMed]
- Zanella A, Salerno D, Scaravilli V, et al. A mathematical model of oxygenation during venovenous extracorporeal membrane oxygenation support. J Crit Care 2016;36:178-86. [Crossref] [PubMed]
- Jegger D, Tevaearai HT, Mallabiabarrena I, et al. Comparing oxygen transfer performance between three membrane oxygenators: effect of temperature changes during cardiopulmonary bypass. Artif Organs 2007;31:290-300. [Crossref] [PubMed]
- Isgrò S, Mojoli F, Avalli L. Monitoring the ECMO Patient: The Extracorporeal Circuit. In: Sangalli F, Patroniti N, Pesenti A. editors. ECMO-Extracorporeal Life Support in Adults. Milan: Springer, 2014:401-11.
- Panigada M, L'Acqua C, Passamonti SM, et al. Comparison between clinical indicators of transmembrane oxygenator thrombosis and multidetector computed tomographic analysis. J Crit Care 2015;30:441.e7-13. [Crossref] [PubMed]
- Kolobow T, Gattinoni L, Tomlinson T, et al. The carbon dioxide membrane lung (CDML): a new concept. Trans Am Soc Artif Intern Organs 1977;23:17-21. [Crossref] [PubMed]
- Zanella A, Mangili P, Redaelli S, et al. Regional blood acidification enhances extracorporeal carbon dioxide removal: a 48-hour animal study. Anesthesiology 2014;120:416-24. [Crossref] [PubMed]
- Castagna L, Zanella A, Scaravilli V, et al. Effects on membrane lung gas exchange of an intermittent high gas flow recruitment maneuver: preliminary data in veno-venous ECMO patients. J Artif Organs 2015;18:213-9. [Crossref] [PubMed]
- Belliato M, Degani A, Buffa A, et al. A brief clinical case of monitoring of oxygenator performance and patient-machine interdependency during prolonged veno-venous extracorporeal membrane oxygenation. J Clin Monit Comput 2017;31:1027-33. [Crossref] [PubMed]
- Belliato M, Cremascoli L, Aliberti A, et al. A case of veno-venous extracorporeal membrane oxygenation for severe respiratory failure in a superobese patient. Clin Case Rep 2016;4:1147-50. [Crossref] [PubMed]
- Lehle K, Philipp A, Hiller KA, et al. Efficiency of gas transfer in venovenous extracorporeal membrane oxygenation: analysis of 317 cases with four different ECMO systems. Intensive Care Med 2014;40:1870-7. [Crossref] [PubMed]
- Lubnow M, Philipp A, Foltan M, et al. Technical complications during veno-venous extracorporeal membrane oxygenation and their relevance predicting a system-exchange--retrospective analysis of 265 cases. PLoS One 2014;9:e112316. [Crossref] [PubMed]
- Epis F, Pagani M, Biglia A, et al. Oxygenator performance assessment from CO2 removal capacity during vvECMO (abstract, poster). 5th EuroELSO. June 2016. Glasgow, UK.
- Dornia C, Philipp A, Bauer S, et al. D-dimers Are a Predictor of Clot Volume Inside Membrane Oxygenators During Extracorporeal Membrane Oxygenation. Artif Organs 2015;39:782-7. [Crossref] [PubMed]
- Lubnow M, Philipp A, Dornia C, et al. D-dimers as an early marker for oxygenator exchange in extracorporeal membrane oxygenation. J Crit Care 2014;29:473.e1-5. [Crossref] [PubMed]
- Epis F, Cremascoli L, Torresani F, et al. D-Dimer and CO2 Removal Capacity: Another Way To Evaluate Oxygenator Performance During ECMO? Eur J Heart Fail 2017;19:59.
- Belliato M, Torresani F, Cremascoli L, et al. Oxygen transfer and extracorporeal shunt during prolonged VV-ECMO. (abstract, oral presentation). 17th European Congress on Extracorporeal Circulation Technology ELSO. June 2017. Marseille, France.
- Da Broi U, Adami V, Falasca E, et al. A new oxygenator change-out system and procedure. Perfusion 2006;21:297-303. [Crossref] [PubMed]

